P O Box 159 • Crestwood, KY 40014 • (877) 243-0042 • (502) 243-0039 fax
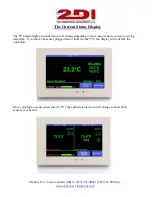
5. The battery icon shown at the bottom of the current status display is for the TV2 internal
rechargeable backup-battery.
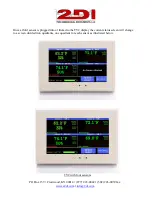
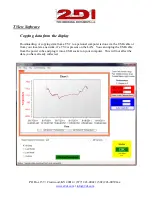
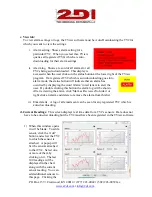
To see a history chart for a sensor, touch that sensor's temperature on the display.
1.
The temperature scale which appears as the Y-axis of the chart, is set in the sensor setup
menu. (There could be temperatures above or below the Y-axis limits)
2.
The number in the upper right-hand corner of the display indicates which sensor’s chart is
being shown (sensor 2 in this example).
3.
The time line along the top of the chart, the X-axis, indicates when the values, in this case
temperature, were collected. The dates on this line will change if you scroll left or right, or
zoom out or in to view additional data.
4.
The bottom two rows of the display show the current day and time along with the most recent
reading from each sensor. Also shown, at the bottom right of the screen, is the zoom level.
(See FAQ on page 35 for an explanation of this feature)
Use the hotspots to switch charts. Lightly touching any of the four temperatures on the bottom of the
display will immediately change the screen to show that sensor’s temperature history chart.
Note: The TV2 stores a lot of data but eventually it fills up. Once it does, the newer
data rolls over the oldest data. If you are sampling data every 10 minutes the last 1.5
years of data will be stored and can be viewed.
Chart for sensor #2
Hot Spots to
switch sensors


