50
Graph View
Sometimes identifying trends in sensor data is easiest when the data is plotted on a
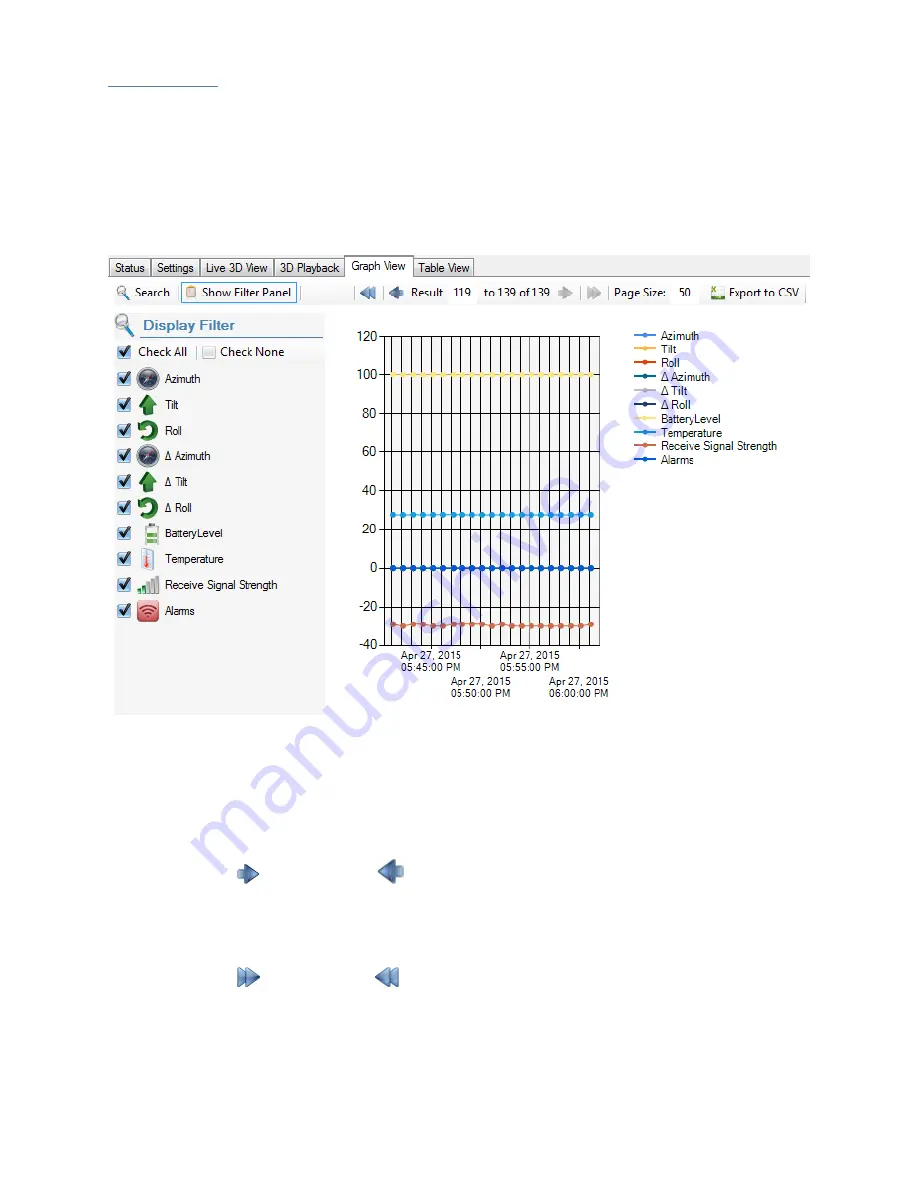
graph. To automatically plot all the downloaded antenna WASP sensor data on a chart,
simply click the “Graph View’ tab in the right pane. If data has already been downloaded
this view will graphically plot the same data as the table view.
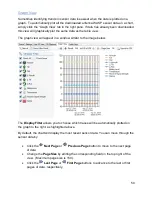
The graph view will appear in a window similar to the image below.
The
Display Filter
allows you to choose which traces will be automatically plotted on
the graph to the right, as highlighted above.
By default, the chart will display the most recent sensor data. You can move through the
sensor data by:
Click the
Next Page
or
Previous Page
button to move to the next page
of data.
Change the
Page Size
by editing the corresponding field on the top right of the
view. (Maximum page size is 150).
Click the
Last Page
or
First Page
buttons to advance to the last or first
pages of data, respectively.
Summary of Contents for Antenna W.A.S.P.
Page 1: ...Antenna W A S P User s Guide...
Page 5: ...5 CE Mark Conformity...
Page 59: ...59 Technical Support Contacts...


