75
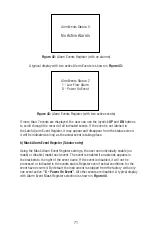
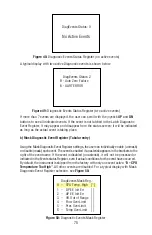
DiagEvents Status: 0
No Active Events
Figure 48:
Diagnostic Events Status Register (no active events)
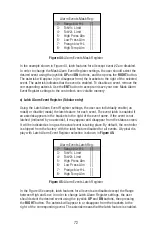
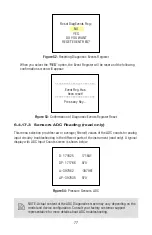
A typical display with two active Diagnostic events is shown below:
DiagEvents Status: 2
B - Auto Zero Failure
8 - UART ERROR
Figure 49:
Diagnostic Events Status Register (two active events)
If more than 7 events are displayed, the user can scroll with the joystick
UP
and
DN
buttons to see all indicated events. If the event is not latched in the Latch Diagnostic
Event Register, it may appear and disappear from the status screen; it will be indicated
as long as the actual event is taking place.
b) Mask Diagnostic Event Register (Tabular entry)
Using the Mask Diagnostic Event Register settings, the user can individually enable (unmask)
or disable (mask) each event. The event is enabled if an asterisk appears in the brackets to the
right of the event name. If the event is disabled (no asterisk), it will not be processed or
indicated in the Events status Register, even if actual conditions for the event have occurred.
By default, the instrument is shipped from the factory with only one event active:
“0 – CPU
Temperature Too High”
. All other events are disabled. For a typical display with Mask
Diagnostic Event Register selection, see
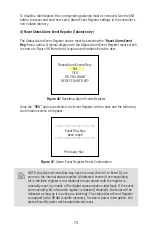
Figure 50:
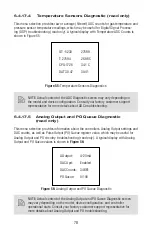
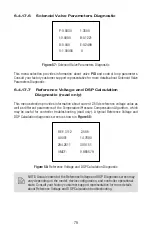
DiagEvents Mask Reg.:
0 – CPU Temp. High [*]
1 – DP EE Init Err [ ]
2 – AP EE Init Err [ ]
3 – VR Out of Range [ ]
4 – Flow OverLimit [ ]
5 – Pres OverLimit [ ]
6 – Temp OverLimit [ ]
Figure 50:
Diagnostic Events Mask Register
Summary of Contents for DPC
Page 6: ...2...
Page 120: ...116 APPENDIX I COMPONENT DIAGRAM Top Component Side...
Page 121: ...117 Bottom Component Side...

