ABB
LGR-ICOS
™ GLA232 Series Methane/Ethane Analyzer User Manual
ABB PROPRIETARY INFORMATION
23
Display
– Toggles through the
Main Panel
display formats:
Numeric Display
– Default display. Displays the numeric readout of the last
measurement. (Figure 9)
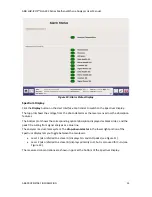
Alarm Status –
Displays the operational status of the analyzer. (Figure 10)
Spectrum Display
– Displays the raw and fitted spectral scans for both lasers. (Figure 11
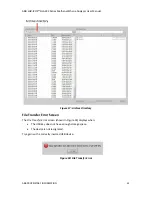
Time Chart Display
– Displays the concentration over time. (Figure 13)
Parameter Window
– Displays the:
Time – Current time
Data File – Current filename to log data
Gas Temperature – Temperature in Cell (Celsius - °C)
Gas Pressure – Pressure in Cell (Torr)
Laser A
τ
– Laser A (1650 nm) ringdown time (micro-seconds - µs)
Laser B
τ
– Laser B (1680 nm) ringdown time (micro-seconds - µs)
Rate – Sampling frequency
Disk Space – Remaining hard-drive space
Files
– Allows easy transfer of files onto USB storage devices.
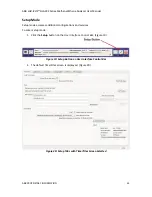
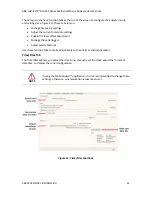
Setup
– Accesses additional configuration and service menus.
Exit
– Exits the application and shuts down the analyzer.
Main Panel Displays
Click the
Display
button to change the display in the
Main Panel
. Clicking the
Display
button
multiple times lets you cycle through the four main panel displays. When the analyzer is
launched, it defaults to the
Numeric Display
. The four main panel displays are:
Numeric
Alarm Status
Spectrum
Time Chart
This section describes the displays.
Numeric Display
This is the default display. It appears when the analyzer is first turned on or re-initialized.
Figure 9 shows the numeric readout of the last measurements of CH
4
, C
2
H
6
, H
2
O, CH
4
(Dry), C
2
H
6
(Dry) in parts per million (ppm). Additionally, the data rate is shown in Hz.

