Operating Manual
3KXG165002R4201_2021_04
ABB PROPRIETARY INFORMATION
22
GLA531 Series LGR-ICOS™ Gas Analyzer
Spectrum Display
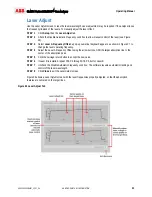
The spectrum display in Figure 17 provides additional information on the reliability of the spectroscopy
measurements:
•
Laser signal strength defined as transmitted intensity level on the Detector Voltage chart (top)
•
Detected light absorptions of the targeted gases shown as small dips on the Detector Voltage chart
•
Absorbance signal intensity of the targeted gases shown as peaks on the Absorbance chart (bottom)
•
Laser frequency linelock at the center of each absorbance window
Figure 17 Spectrum Display

