to the fault from the currents and voltages at one line end. If this is not done, the
accuracy of the calculated figure will vary with the load flow and the amount of
additional fault resistance.
The calculation algorithm used in the fault locator in compensates for the effect of double-
end infeed, additional fault resistance and load current.
15.5.2.2
Accurate algorithm for measurement of distance to fault
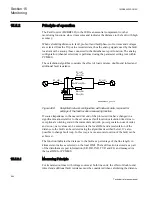
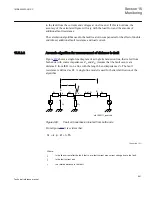
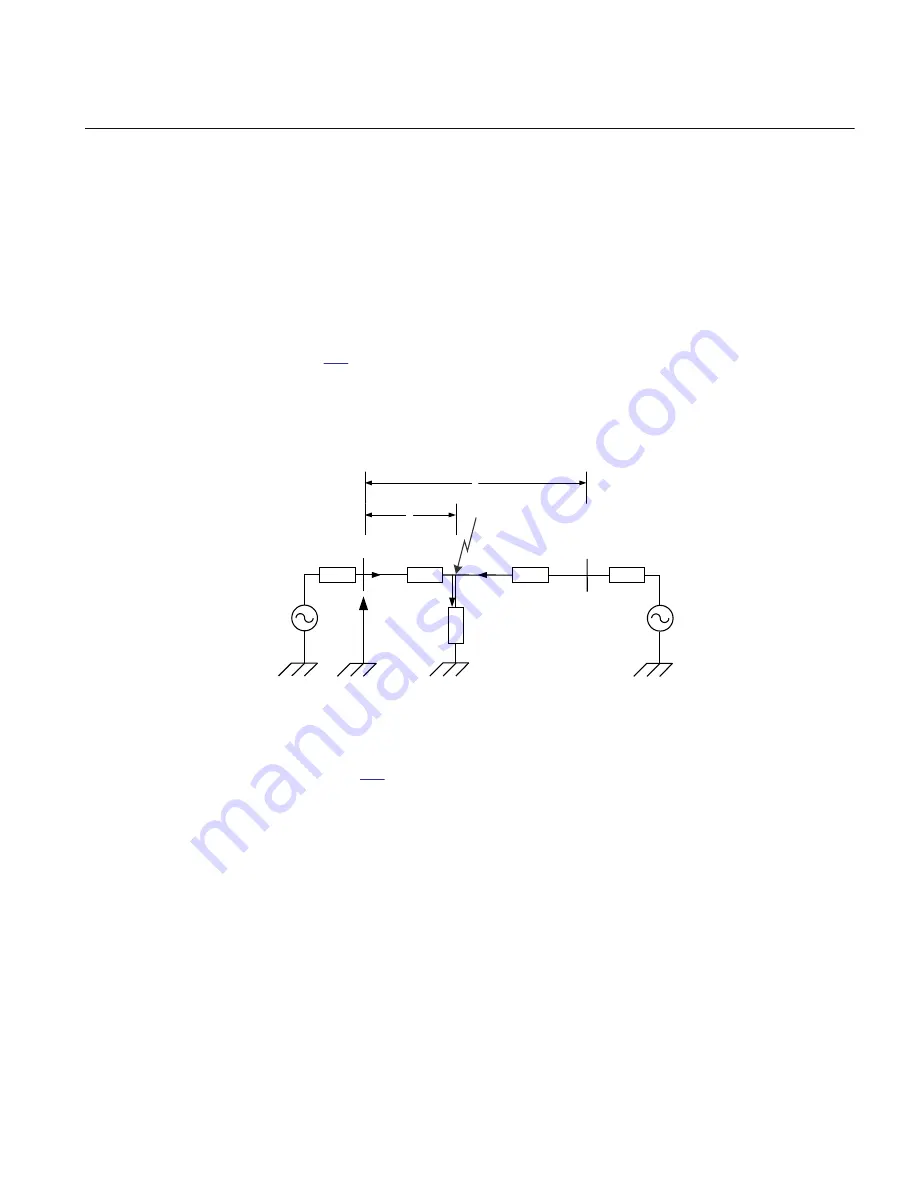
Figure
shows a single-line diagram of a single transmission line, that is fed from
both ends with source impedances Z
A
and Z
B
. Assume that the fault occurs at a
distance F from IED A on a line with the length L and impedance Z
L
. The fault
resistance is defined as R
F
. A single-line model is used for better clarification of the
algorithm.
Z
A
pZ
L
A
I
F
(1-p).Z
L
B
Z
B
F
L
I
B
I
A
xx01000171_ansi.vsd
R
F
A
V
ANSI01000171 V1 EN
Figure 469:
Fault on transmission line fed from both ends
From figure
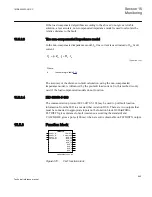
= × ×
+ ×
A
A
L
F
F
V
I p Z
I R
EQUATION1595 V1 EN
(Equation 181)
Where:
I
A
is the line current after the fault, that is, pre-fault current plus current change due to the fault,
I
F
is the fault current and
p
is a relative distance to the fault
1MRK505222-UUS C
Section 15
Monitoring
941
Technical reference manual
Summary of Contents for Relion 670 series
Page 1: ...Relion 670 series Line differential protection RED670 ANSI Technical reference manual...
Page 2: ......
Page 40: ...34...
Page 50: ...44...
Page 60: ...54...
Page 126: ...120...
Page 384: ...378...
Page 496: ...490...
Page 556: ...550...
Page 602: ...596...
Page 620: ...614...
Page 794: ...788...
Page 864: ...858...
Page 988: ...982...
Page 998: ...992...
Page 1084: ...1078...
Page 1164: ...1158...
Page 1168: ...1162...
Page 1220: ...1214...
Page 1230: ...1224...
Page 1231: ...1225...

