16
©2015-2017 Acclima, Inc.
Toll Free 1-866-887-1470
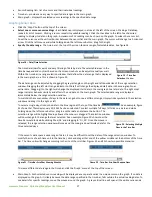
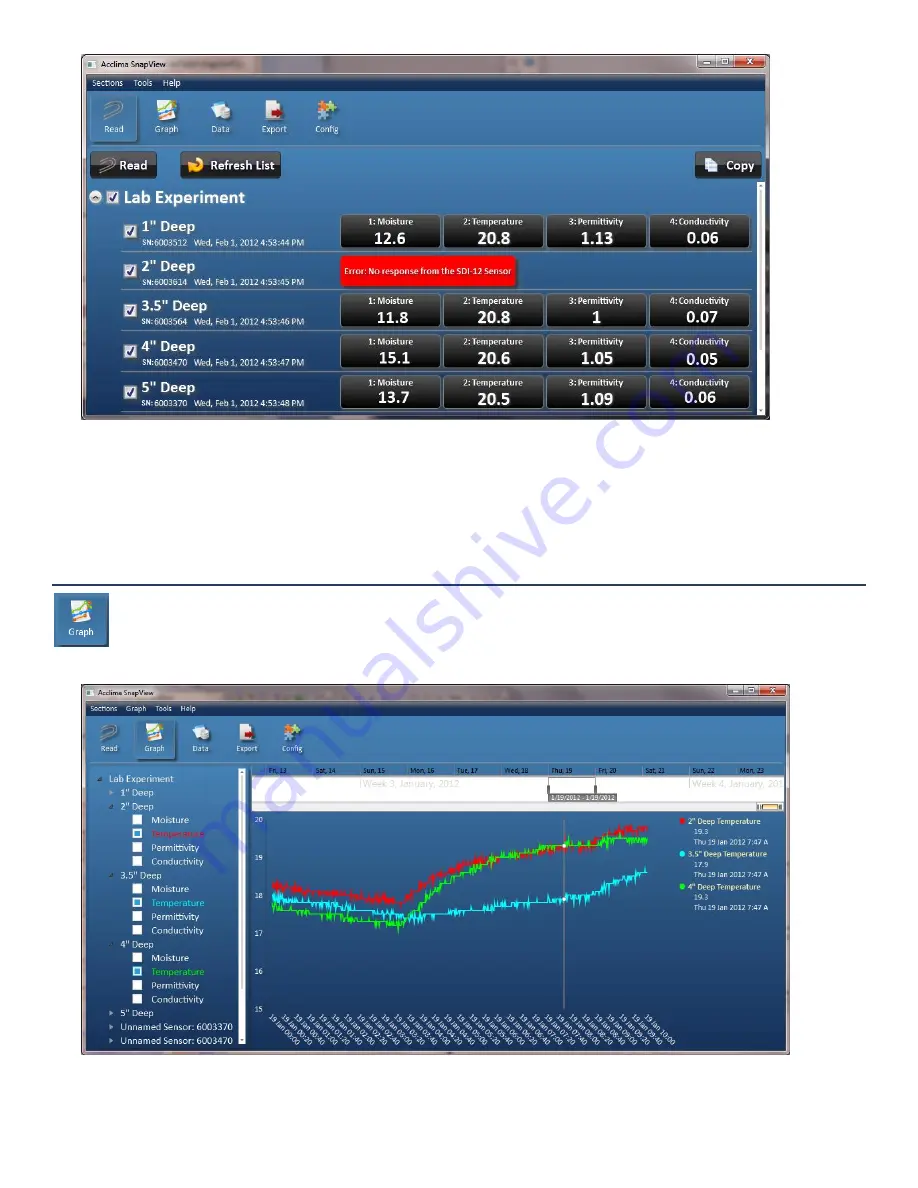
Figure 16
–
Read Sensors
Copying Sensor Data
•
Click the ‘
Copy
’ button to
co
py all sensor data to the Windows™
clipboard in a comma delimited list, one line per sensor.
This allows the sensor data to b
e easily pasted into any Windows™
application.
View Graphs
S
ensor readings for all sensors can be viewed visually through the ‘Graph’
screen. To see the
‘Graph’
screen, click on the
‘
Graph
’
button at the top of the screen. The graph view allows access to the historical data of each DataSnap that has
ever been connected to this PC. It does not require a DataSnap to be connected.
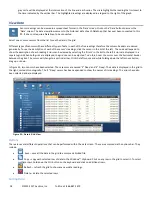
Figure 17
–
Data in Graph View
The Graph view has 3 main sections.


