background image


18


©2015-2017 Acclima, Inc.


Toll Free 1-866-887-1470 

gray circle will be displayed at the intersection of the line and each series. The circle highlights the reading that is closest to 
the time indicated by the vertical bar. The highlighted readings are displayed in a legend to the right of the graph. 


View Data 

Sensor readings 

can be viewed in a spreadsheet format in the ‘Data’ 

screen. C

lick on the ‘Data’ button

 to access the 

‘Data’ screen.

 The data view allows access to the historical data of each DataSnap that has ever been connected to this 

PC. It does not require a DataSnap to be connected.  
 

Select one or more sensors from the list to see the data in the grid.  
 
Different types of sensors will have different types of data in each of the five readings therefore the column headers are named 
generically. To see the descr

iption of each of the sensor’s readings, 

click the sensor in the list at the left.  The node will expand to 

show the description of each reading. 

Errors can be viewed by selecting the ‘Errors’ in the list to the left. Errors are displayed in a 

separate grid. When both grids are displayed, the grid size can be adjusted. To do this, hover the cursor over the horizontal border 
between the grids. The cursor will change to a vertical arrow. Click the left mouse and while holding down the left mouse button, 
drag up or down. 
 
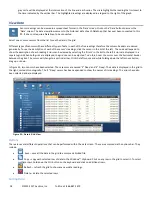
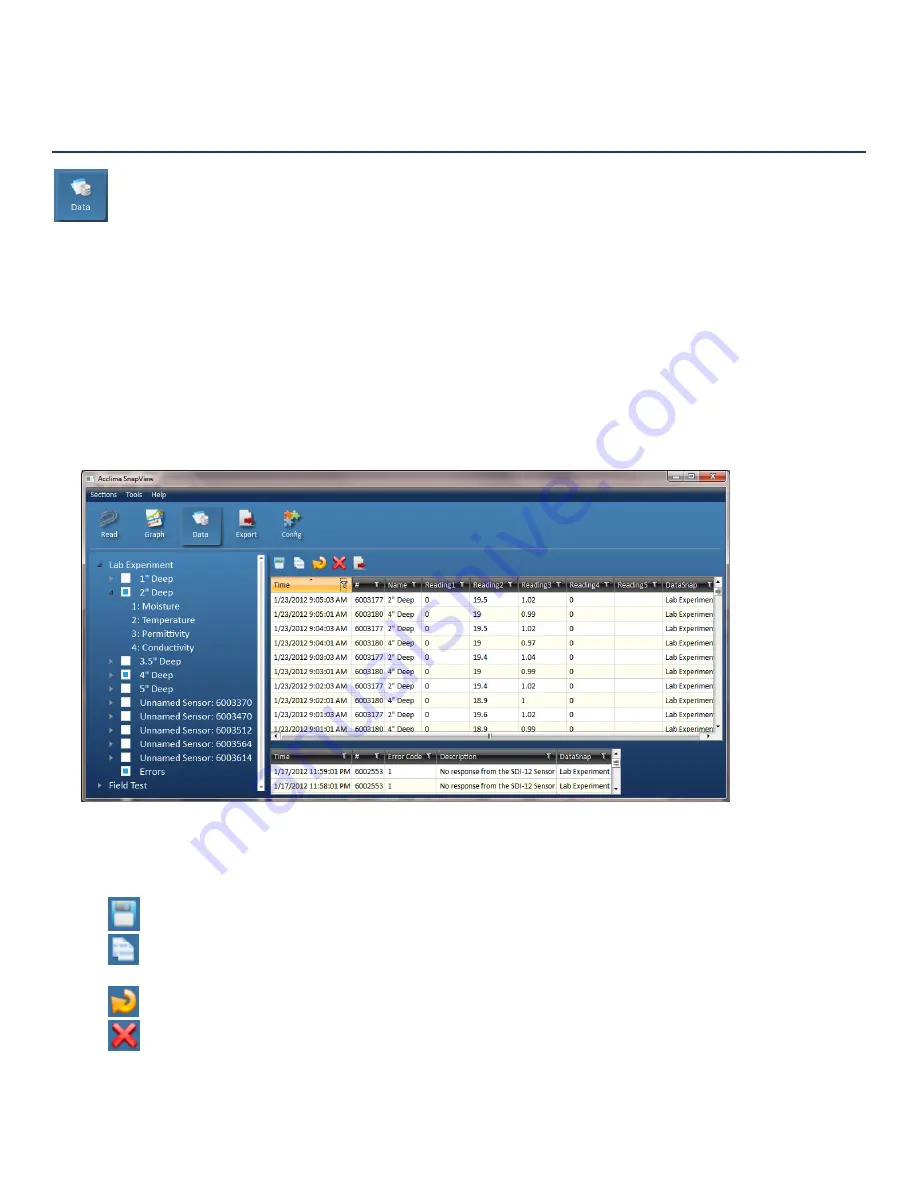
In figure 23, two sensors 

have been selected. Those sensors are named ‘2” Deep’ and ‘4” Deep’. Their data is displayed in the grid to 

the right, sorted chronologically

. The ‘2” Deep’ sensor has been expanded to show the names of its readings. 

The errors have also 

been selected and are displayed. 


Figure 23 

 Data in Grid View 

Options 

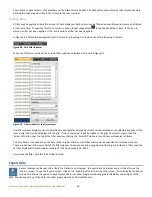
There are several different operations that can be performed within the data screen. These are accessed via the options bar. They 
include: 


   Save 

 save all the data in the grid to a comma delimited file. 


  Copy 

 copy each selected row of data to the Windows

 clipboard. Click on any row in the grid to select it. To select 

multiple rows, hold down the Ctrl button on the keyboard and click on additional rows. 


  Refresh 

 refresh the grid to show any new data readings. 


  Delete 

 delete the selected rows 

Sorting Data 

Summary of Contents for ACC-AGR-D01

Page 1: ...DataSnap User Manual SDI 12 Data Recorder Part Number ACC AGR D01...

Page 2: ...Up a New System 7 Selecting Acclima Moisture Sensor Locations 8 Installing Acclima Moisture Sensors 8 Wiring Sensors to the SDI 12 port 8 Using Acclima SnapView Software 10 Configuration 10 Automatic...

Page 3: ...aSnap 2 pluggable terminal blocks for the SDI 12 connection USB cable type A B AC power adapter 12V DC battery power pack Installation CD with SnapView software and driver Supported Sensors The Acclim...

Page 4: ...can be unplugged from the DataSnap while wiring sensors together Multiple sensors can be wired in parallel to the same SDI 12 port External Power Port This connection is provided should the sensor ne...

Page 5: ...via a USB cable Windows will automatically detect the new Data Snap hardware and will attempt to find the appropriate driver This driver installation process will only occur once per Data Snap Each n...

Page 6: ...because the driver was installed to this location when the SnapView software was installed Figure 3 Once the driver is found and installed the Data Snap will be assigned to a port and will be availabl...

Page 7: ...aSnap Each newly added sensor is configured with a set of default properties that can be changed at any time This is addressed later in this document Add non Acclima Sensors Each non Acclima sensor mu...

Page 8: ...ort soil moisture as a percentage of the total volume measured This means that the measured volume of soil should be free of foreign objects or variations that may alter the measurement made by the se...

Page 9: ...res to a separate single wire and then connecting the single new wire to the terminal block in the appropriate position Follow the same procedure to connect the white and blue wires The wiring should...

Page 10: ...top of the screen This will display the Configuration wizard The SDI 12 protocol requires that a sensor be given a specific address All communication with a sensor is based on this address When a sen...

Page 11: ...ormed on the connected DataSnap Click the Refresh List button to scan the computer for DataSnaps and update the connection list System Configuration Settings The system configuration screen allows mod...

Page 12: ...It is not limited to Acclima sensors The DataSnap must be configured to know which sensors to read This is done by adding sensors in the Sensors screen The current list of configured sensors is displ...

Page 13: ...e can be changed at any time The DataSnap does not support duplicate serial numbers If there are one or more sensors with the same serial number the sensor that was configured last will be used Modify...

Page 14: ...en Hovering the mouse over the icon displays the number of logs that still need to be retrieved from the DataSnap as shown in figure 18 If one or more DataSnaps are connected via a USB port the SnapVi...

Page 15: ...p s name To expand collapse the list of sensors click the gray circle or click the DataSnap s name Individual sensors can be selected deselected by clicking the checkmark next to the sensor name Figur...

Page 16: ...to be easily pasted into any Windows application View Graphs Sensor readings for all sensors can be viewed visually through the Graph screen To see the Graph screen click on the Graph button at the t...

Page 17: ...right will change the displayed start date in the main graph to a later date The right most range indicator behaves similarly and effects the end date on the main graph The selected date range is dis...

Page 18: ...e viewed by selecting the Errors in the list to the left Errors are displayed in a separate grid When both grids are displayed the grid size can be adjusted To do this hover the cursor over the horizo...

Page 19: ...can be selected or not selected as desired If an item is selected it will be displayed in the grid If it is not selected it will be hidden in the grid To select all items click the Select All option...

Page 20: ...Field Test Only data between 5am on January 16 2012 and 9 30pm on January 23 2012 will be exported The output file will be named myDataSnapExport csv and will be saved in the C data folder Tools The t...

Page 21: ...eric COM port on that computer This COM port should be visible in Device Manager as Acclima Virtual COM port The communications settings for this COM port are unimportant and can be ignored since the...

Page 22: ...22 2015 2017 Acclima Inc Toll Free 1 866 887 1470 Acclima Inc 1763 West Marcon Lane Ste 175 Meridian ID 83642 USA www acclima com...

Reviews: