90
1.
j
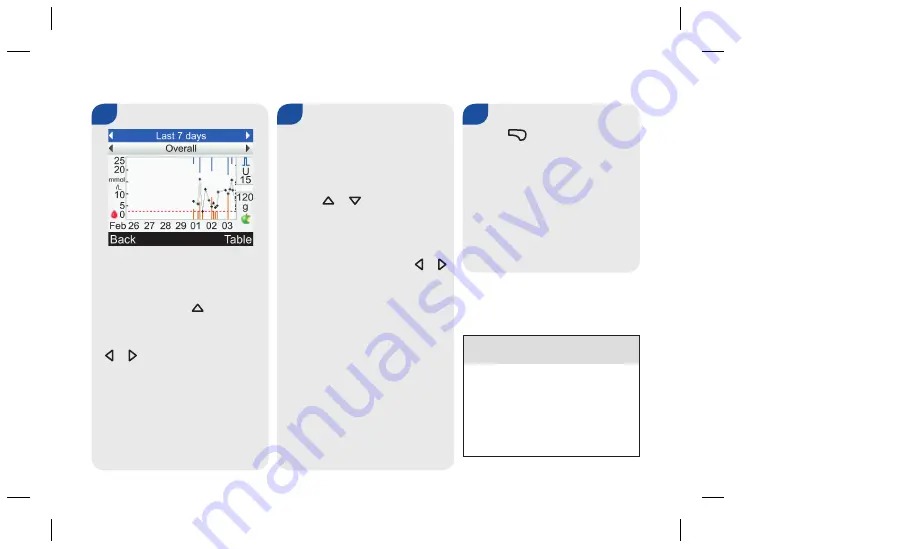
To display a trend graph for
another time range (last
8 hours, 24 hours, 48 hours,
or 7 days), press
x
to highlight
the time range selection field
(top of screen). Press either
<
or
>
until you reach the time
range you need.
2.
j
To display a trend graph for
another meal time selection
(Overall, Pre Meal, Post Meal,
Bedtime, or Other), press
either
x
or
z
to highlight
the meal time selection field
(immediately below the time
range which is at the top of
the screen). Press either
<
or
>
until you reach the meal time
selection you need.
Trend Graph
3.
j
Press
.
to display the table
(proceed to the next section
for more information).
To return to the Reports
screen, select Back.
i
NOTE
The meter saves the current
settings (time range, meal
time, and graph view) when
you select Back or when the
meter turns off.
50839_06434240002.indb 90
7/2/12 3:25 PM
Summary of Contents for Aviva Expert
Page 8: ...6 50839_06434240002 indb 6 7 2 12 3 24 PM ...
Page 234: ...232 50839_06434240002 indb 232 7 2 12 3 26 PM ...
Page 244: ...242 50839_06434240002 indb 242 7 2 12 3 26 PM ...
Page 252: ...250 50839_06434240002 indb 250 7 2 12 3 26 PM ...
Page 258: ...256 W warnings list of 194 198 weight loss 52 50839_06434240002 indb 256 7 2 12 3 26 PM ...


