Installation and Operation Manual
Chapter
6 Monitoring and Diagnostics
ACE-3105, ACE-3205 Ver. 5.2
Monitoring Performance
6-27
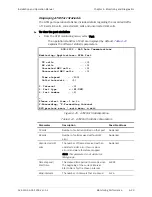
Table
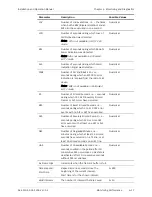
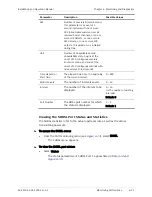
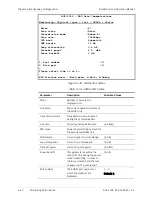
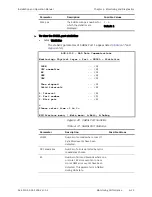
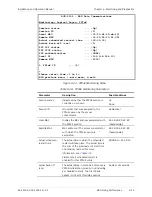
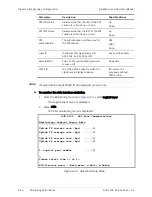
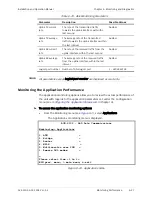
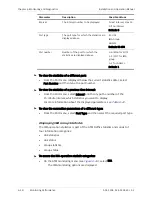
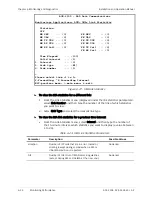
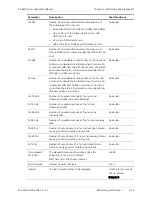
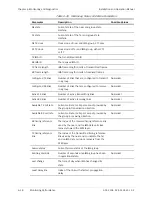
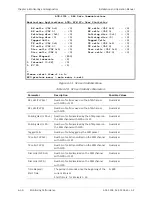
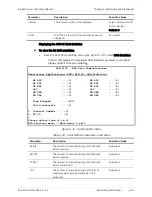
6-19. Abis Monitoring Parameters
Parameter Description
Possible
Values
Uplink TX current
rate
The rate of the transmitted traffic
towards the uplink interface within the
last second
Number
Uplink TX average
rate
The average rate of the transmitted
traffic towards the uplink interface within
the last interval
Number
Uplink RX current
rate
The rate of the received traffic from the
uplink interface within the last second
Number
Uplink RX average
rate
The average rate of the received traffic
from the uplink interface within the last
interval
Number
Logical port number Number of Abis logical port
1 – 4294967295
All parameters except Logical port number are displayed as read-only.
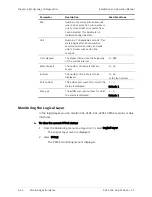
Monitoring the Application Performance
The application monitoring options allow you to review the actual performance of
the unit with regards to the application parameters set under the Configuration
menu (see
Configuring the Application Parameters
in Chapter 4).
³
To access the application monitoring options:
•
From the Monitoring menu (see
), select Applications.
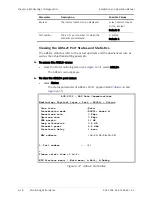
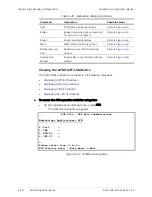
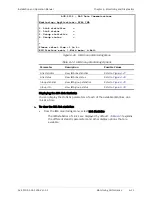
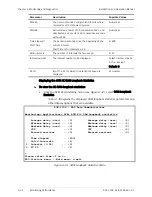
The Applications monitoring menu is displayed.
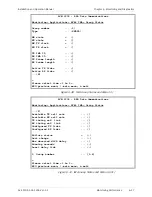
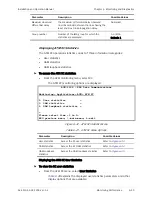
ACE-3205 – RAD Data Communications
Monitoring> Applications
1. ATM >
2. Bridge >
3. Router >
4. MPLS >
5. Multiservice over PSN >
6. Remote DSL modem >
>
Please select item <1 to 6>
ESC-prev. menu; !-main menu; &-exit
Figure
6-23. Applications Menu
Note

