Installation and Operation Manual
Chapter
6 Monitoring and Diagnostics
ACE-3105, ACE-3205 Ver. 5.2
Monitoring Performance
6-43
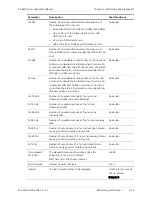
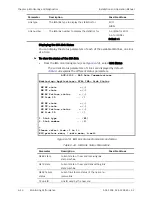
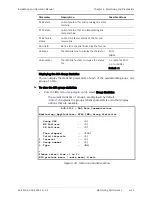
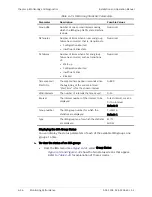
Table
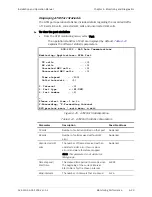
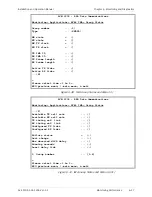
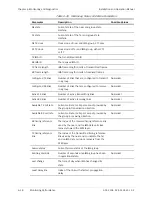
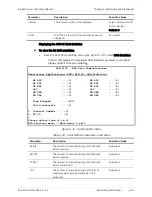
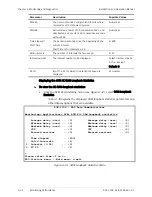
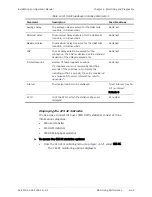
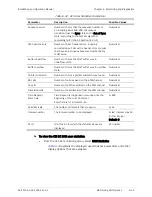
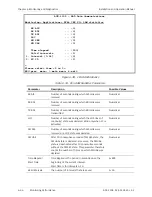
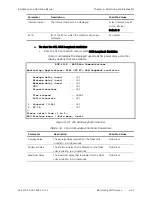
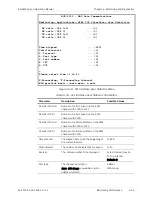
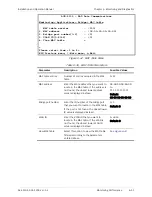
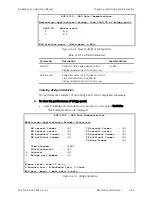
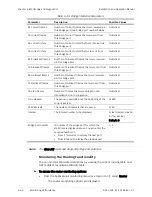
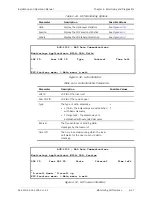
6-30. OAM Loopback Statistics Parameters
Parameter Description
Possible
Values
Average delay
The average delay measured for the OAM cells
roundtrip, in microseconds.
Numerical
Minimum delay
The minimum delay measured for the OAM cells
roundtrip, in microseconds.
Numerical
Maximum delay
The maximum delay measured for the OAM cells
roundtrip, in microseconds.
Numerical
CDV
The cell delay variation measured for the
connection. The CDV is calculated as the standard
deviation of the delay measurements.
Numerical
Errored sessions
Number of failed loopback sessions.
If a loopback cell is not received back within 5
seconds (if the cell does not complete the
roundtrip within 5 seconds), the cell is considered
as a failed cell (for more information, refer to
Appendix C'
).
Numerical
Interval
The interval number to be displayed
0–last interval, max 24
0 if no interval
Default: 0
XC ID
ID of the XC for which the statistics above are
displayed
XC number
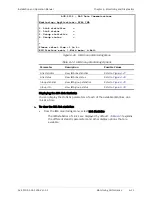
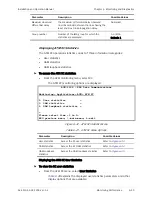
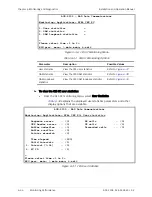
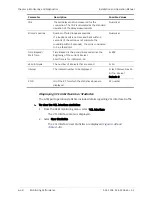
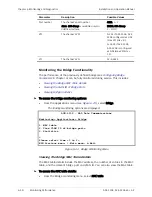
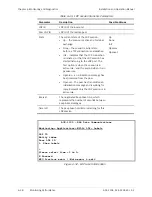
Displaying the CES XC Statistics
The CES cross-connect (CES over ATM) traffic statistics consist of three
information categories:
•
CES user statistics
•
CES OAM statistics
•
CES OAM loopback statistics.
³
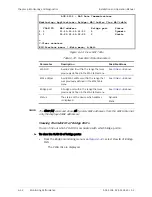
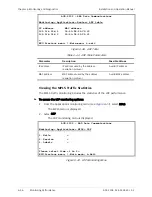
To access the CES XC statistics options:
•
From the CES XC monitoring menu (see
), select CES XC.
The CES XC monitoring options displayed.

