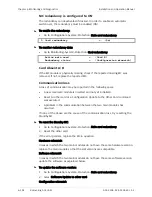
Chapter
6 Monitoring and Diagnostics
Installation and Operation Manual
6-104
Recovering ACE Units
ACE-3105, ACE-3205 Ver. 5.2
2.
Observe the frequency of the Jitter buffer underruns.
In cases where they periodically recur, continue investigating the clocking
settings and the topology.
The frequency of the Underruns can be easily analyzed using the log file.
In cases where a specific pattern cannot be identified, continue as
follows:
3.
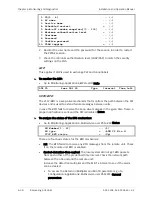
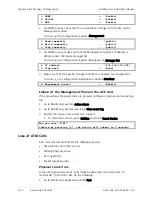
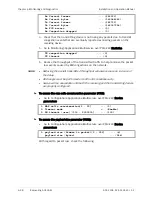
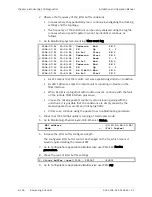
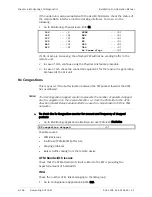
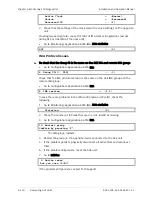
Go to Monitoring>System>Event log>View event log.
2008-07-16 10:01:25 | Underrun End PW 3
2008-07-16 10:01:25 | PW Up 3 - 3
2008-07-16 10:01:24 | Rx R=1 Start PW 3
| 2008-07-16 10:01:24 | Underrun Start PW 3
v 2008-07-16 10:01:24 | PW Down 3 - 3
2008-07-16 10:00:23 | Rx R=1 End PW 3
2008-07-16 09:50:33 | Underrun End PW 3
2008-07-16 09:50:33 | PW Up 3 - 3
2008-07-16 09:50:32 | Rx L|M=100 End PW 3
2008-07-16 09:50:04 | Rx R=1 Start PW 3
Rx R=1 means that the remote unit was experiencing Underrun condition.
Rx L|M=100 means that the remote unit is reporting on failure on the
TDM interface.
When Rx L|M is up together with Underrun event, continue with the fault
on the remote TDM interface procedure.
In case the missing packets counter is also increasing along with the
underruns, it is possible that the underruns are simply caused by the
massive packet loss events and not by high PDV.
In this case, continue using the packet loss troubleshooting procedure.
4.
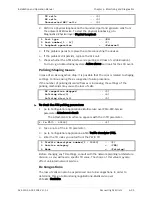
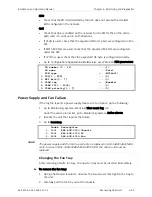
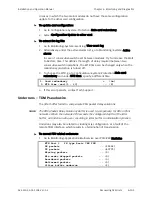
Check that the ETH/GbE uplink is running at Full-Duplex mode:
5.
Go to Monitoring>Physical layer>Port>Ethernet>Status.
MAC address
... (00-20-D2-2A-60-55)
Mode
> (Full Duplex)
6.
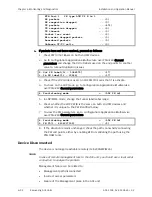
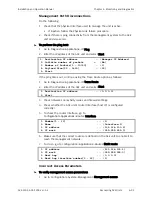
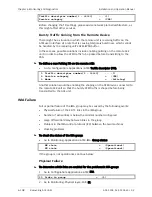
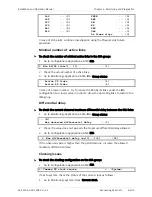
Increase the jitter buffer configured depth.
The configured jitter buffer cannot be changed on the fly, which means it
would require deleting the relevant PW.
7.
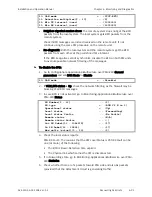
Go to Configuration>Applications>Multiservice over PSN>PW>Service
parameters.
8.
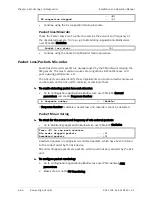
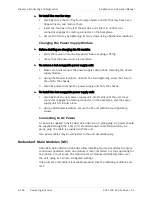
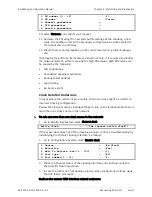
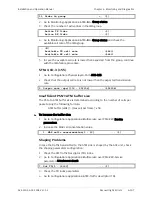
Check the current jitter buffer settings.
2. Jitter buffer (usec)[1000 - 32000] ... (3000)
9.
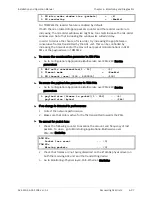
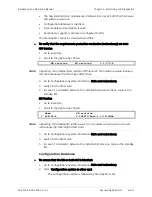
Go to Configuration>Applications>Multiservice over PSN>PW.

