© Acronis, Inc
37
To update an Acronis component on a remote computer, perform the same procedure.
4.3 Browsing logs
To view operation logs of the Acronis OS Deploy Server or Acronis PXE Server, connect the console to
the server. Logs are displayed in the lower part of the console window.
The log browsing window can be accessed by selecting
Tools -> Show log
.
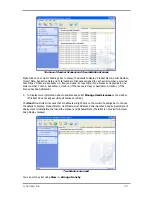
The log browsing window contains two panes: the left one features the log list, while the right one
shows selected log contents.
The left panel can contain up to 50 logs. If there are more, you can browse the list using the
More
and
Less
buttons with the left and right arrows.
To delete a log, select it and click
Delete
.
If any step was terminated by an error, the corresponding log will be marked with a red circle with a
white “X” inside.
The right window features the list of steps contained in the selected log. The three buttons to the right
control message filters: the white “X” in the red circle filters error messages, the exclamation sign in a
yellow triangle filters warnings, and the “i” in the blue circle filters information messages.
To select columns (step parameters) to display, right-click the headers line or left-click the
Choose
Details
button. Then check the desired parameters.
To sort messages by a particular parameter, click its header (click again to reverse order) or the
Arrange Icons by
button (the second from the right) and select the desired parameter.
You can also change column width by dragging the borders with a mouse.
Summary of Contents for SNAP DEPLOY 3 - FOR WORKSTATION
Page 1: ......


