Adamczewski GmbH
Manual AD-MM 500 FE
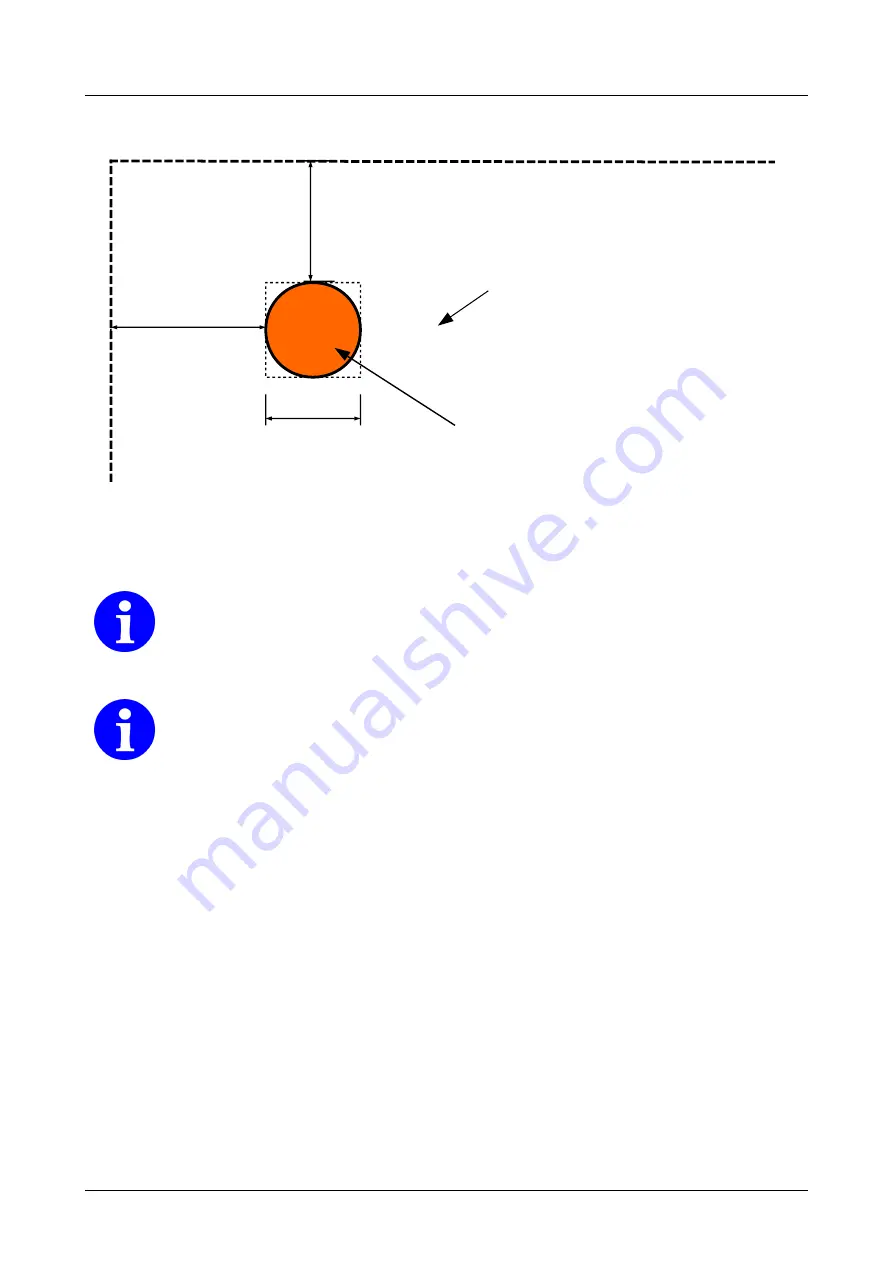
Displayrand
D
is
p
la
yr
a
nd
Links
O
be
n
Durchmesser
Stan
dard
farb
e,
Alte
rnati
vfarb
e
Pumpe 1
Label, Position
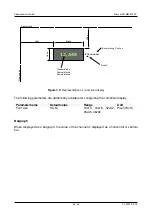
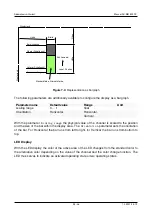
Figure 7.5:
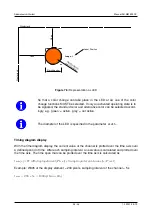
Representation as LED
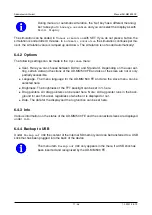
So that a color change can take place in the LED at all, one of the color
change functions MUST be selected. If only an activated operating state is to
be signaled, the standard color and alternative color can be selected accord-
ingly, e.g. ’green’ = active, ’gray’ = not active.
The diameter of the LED is specified in the parameter
Width
.
Timing diagram display
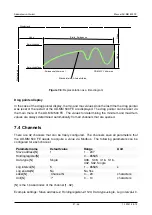
With the time diagram display, the current value of the channel is plotted over the time axis over
a defined period of time. After each sampling interval, a new value is calculated and plotted over
the time axis. The time span that can be plotted over the time axis is calculated as
t
delta
[
s
] =
W idthdisplayelement
[
P ixel
]
∗
Samplingintervalchannel
[
s/P ixel
]
Example: Width of the display element = 200 pixels, sampling interval of the channel = 5 s
t
delta
= 200
∗
5
s
= 1000
s
(16
min,
40
s
)
26 / 36
1.0 2021-05-19


