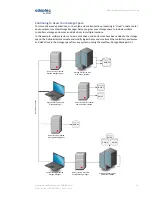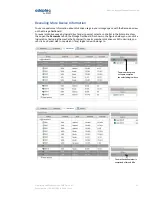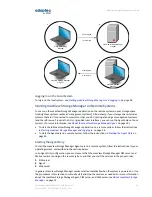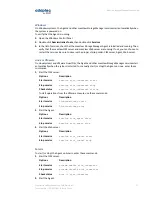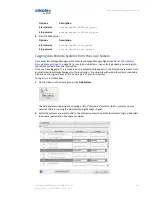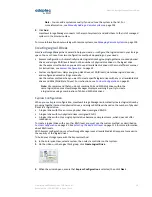
For more information about the types of information provided on the Storage Dashboard for each
component in your storage space, see
Viewing Component Status in the Storage Dashboard
on page
90; also see
Revealing More Device Information
on page 33.
Checking System Status from the Main Window
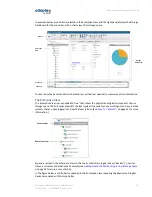
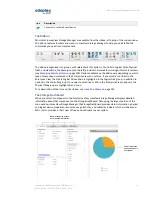
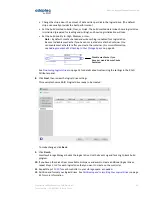
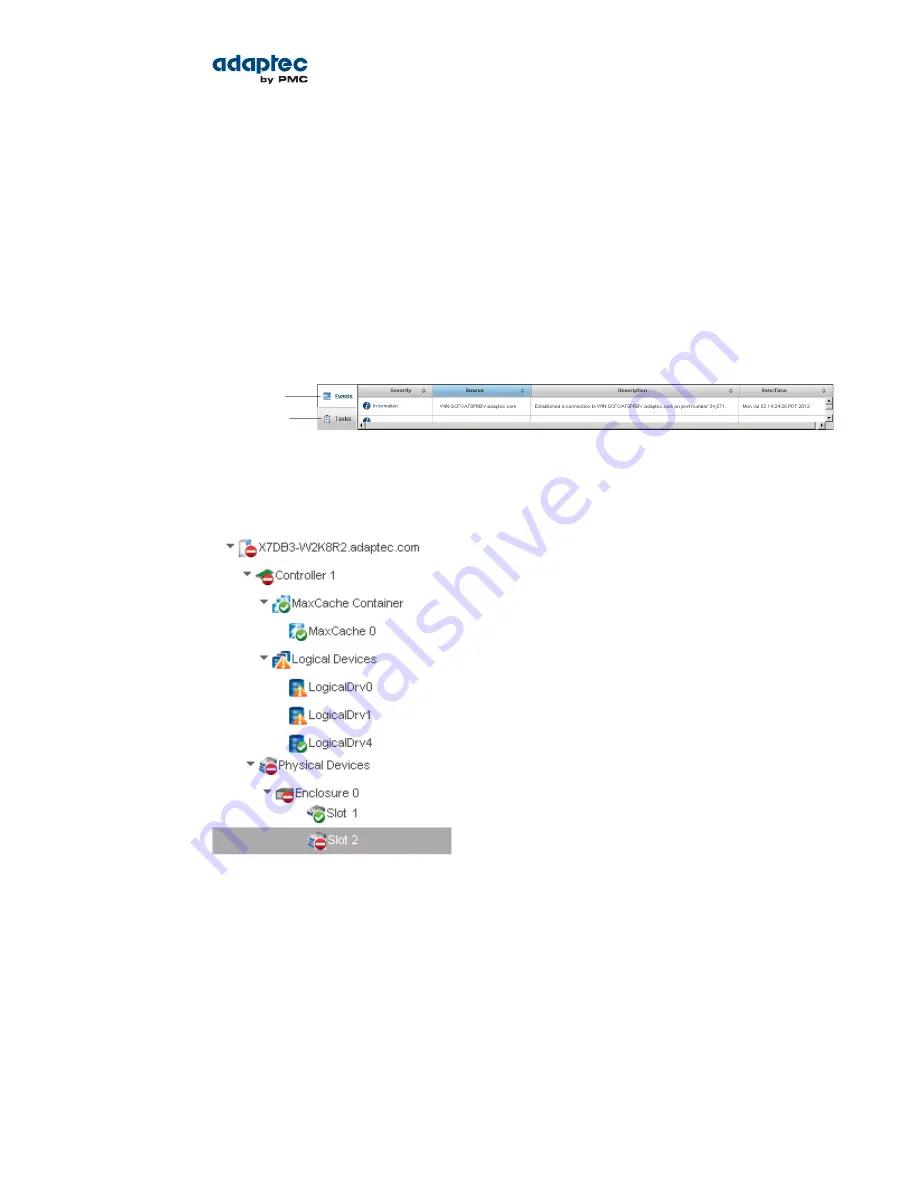
maxView Storage Manager includes an Event Log and Task Log for at-a-glance status and activity
information for all managed systems. The Event Log provides status information and messages about
activity (or events) occurring in your storage space. The Task Log provides information about current or
recurring processes in your storage space, such as the creation of a logical drive. Single-click any event
or task to see more information in an easier-to-read format. For more information about the Event
Log and Task Log, see
Viewing Activity Status in the Event Log
on page 89 and
Working with Scheduled
Tasks
on page 71.
Click this tab to open
the Event Log
Click this tab to
open the Task Log
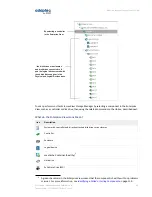
Warning- and Error-level icons appear next to components in the Enterprise View affected by a failure
or error, creating a trail, or rapid fault isolation, that helps you identify the source of a problem when
it occurs. See
Identifying a Failed or Failing Component
on page 110 for more information.
If your storage space includes a drive enclosure with a temperature sensor, temperature, fan, and power
module status is displayed on the Storage Dashboard (see
Monitoring Enclosure Status
on page 92).
For more information about checking status from the main window, see
Monitoring Status and Activity
on page 88.
32
Proprietary and Confidential to PMC-Sierra, Inc.
Document No.: CDP-00278-02-A Rev. A, Issue:
maxView Storage Manager User's Guide


