TRACER 6000 Series Split System Manual
Section 5 User Interface Guide
612806320L1-1B
77
> T1
X
P
ERFORMANCE
H
ISTORY
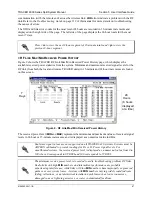
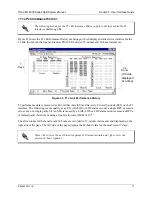
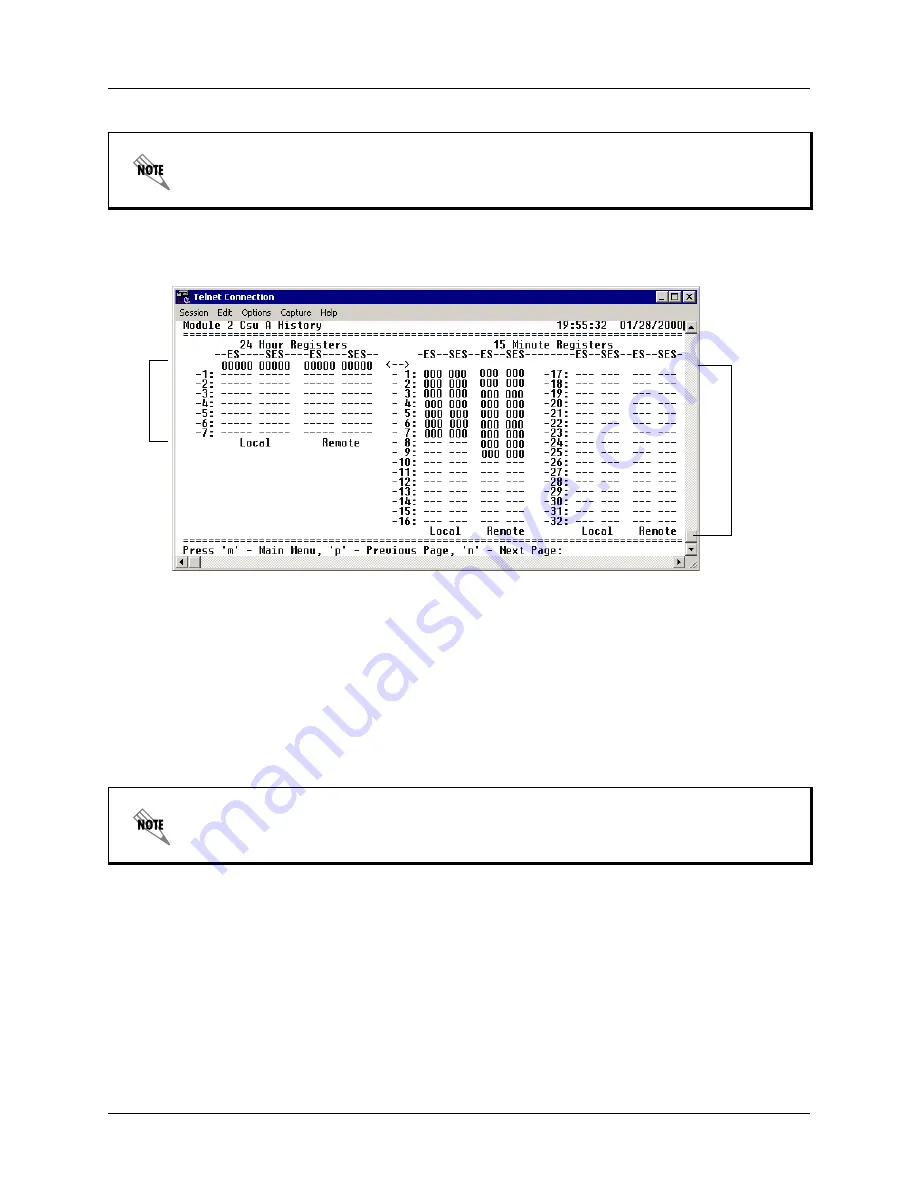
Figure 25 shows the T1x Performance History menu page, which displays detailed error statistics for the
T1 link (from both the local and remote TRACER units) in 15-minute and 24-hour increments.
Figure 25. T1x Link Performance History
T1 performance data is presented as Errored Seconds (ES) and Severely Errored Seconds (SES) on the T1
interface. The following events qualify as an ES: AIS, LOS or LOF alarm second, a single BPV, excessive
zero event, or a single parity bit. An SES is caused by an AIS, LOS or LOF alarm second, excessive BPVs,
or framed parity-bit errors causing a line bit error rate (BER) of 10
-6
.
The error counts for the most recent 24 hours are recorded in 15-minute increments and displayed on the
right side of the page. The left side of the page displays the 24-hour totals for the most recent 7 days.
The following menus for the T1x Performance History apply to all four available T1
interfaces (
A
through
D
).
Press
<
n
>
to view the next 8-hour segment of 15-minute totals and
<
p
>
to view the
previous 8-hour segment.
24
Hours
7
Days
(8 hours
displayed
at a time)

