


D1
Appendix D
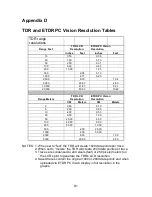
TDR and ETDR PC Vision Resolution Tables
TDR range
resolutions
Range Feet
TDR LCD
Resolution
ETDR PC Vision
Resolution
inches
Feet
inches
Feet
10
0.50
0.06
20
1.00
0.13
50
2.50
0.31
100
5.00
0.63
200
10.00
1.25
500
2.08
3.13
1,000
4.17
6.25
2,000
8.33
1.04
5,000
20.83
2.60
10,000
41.67
5.21
20,000
83.33
10.42
Range Meters
TDR LCD
Resolution
ETDR PC Vision
Resolution
CM
Meters
CM
Meters
2
0.80
0.10
5
2.00
0.25
10
4.00
0.50
20
8.00
1.00
50
20.00
2.50
100
40.00
5.00
200
80.00
10.00
500
2.00
25.00
1000
4.00
50.00
2000
8.00
1.00
5000
20.00
2.50
NOTES: 1. When set to “feet” the TDR will create 1920 data points per trace.
2. When set to “meters” the TDR will create 2000 data points per trace.
3. Traces are condensed to 240 pixels (feet) or 250 pixels (meters) on
the LCD’s plot to generate the TDR’s LCD resolution.
4. Saved traces contain the original 1920 or 2000 data points and when
uploaded via ETDR PC Vision display in full resolution in the
graphs.