


57
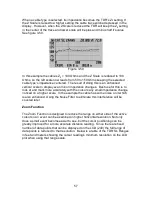
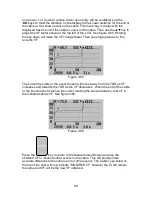
When a cable type is selected. its impedance becomes the TDR’s Z
0
setting. If
the Z Scale is raised to a higher setting the cable trace will be depressed in the
display. However, when the Z Scale is reduced the TDR will keep the Z
0
setting
in the center of the trace and lower scale will be plus and minus half it’s value.
See figure 3-50.
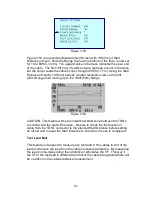
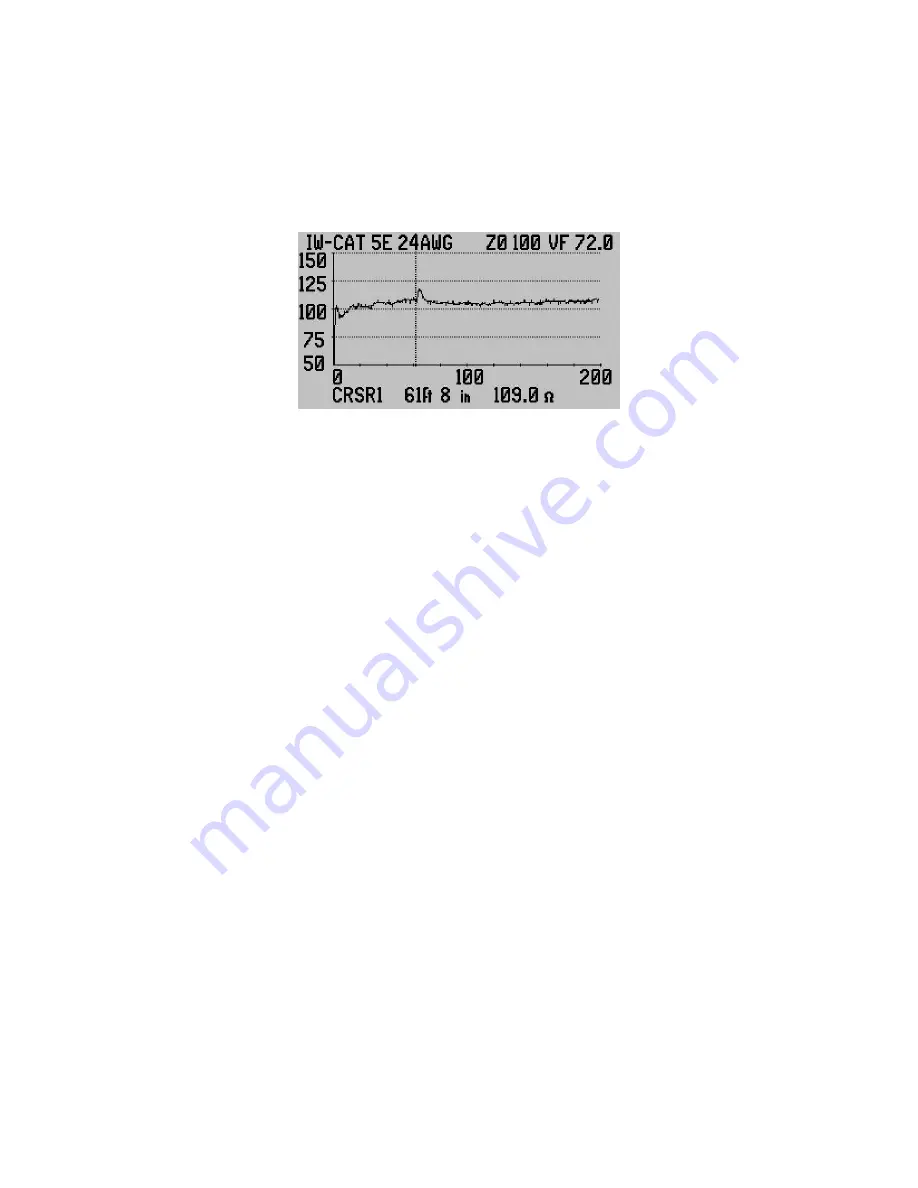
Figure 3-50
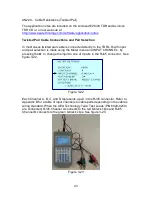
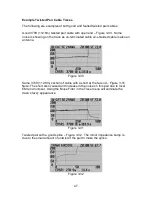
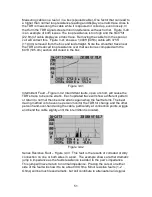
In this example the cable’s Z
0
= 100 Ohms and the Z Scale is reduced to 100
Ohms, so the left scale now reads from 50 to 150 Ohms keeping the selected
cable type’s impedance centered. The result of doing this is an enhanced
vertical scale to display even minor impedance changes. Best use for this is to
look at and mark more accurately with the cursors any small impedance change
noticed on a higher scale. In the example the cable has some noise on it which
is also enhanced. Using the Noise Filter to eliminate this interference will be
covered later.
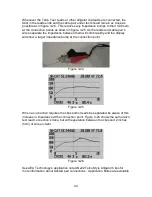
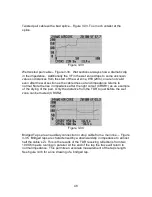
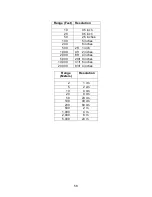
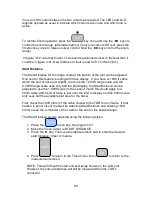
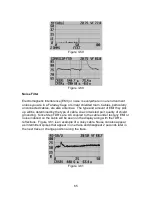
Zoom Function
The Zoom Function is designed to reduce the range on either side of the active
cursor so an event can be examined in higher horizontal resolution. Not only
does a small event become easier to see, but the cursor positioning can be
greatly improved for a more accurate distance reading. Since there are fixed
number of data points that can be displayed on the LCD (240) the full range of
data points is reduced to that resolution. Below is a table of the TDR’S’s Ranges
in feet and meters showing the cursor reading’s minimum resolution on the LCD
plot when using that range scale.


