90
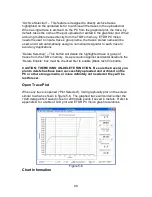
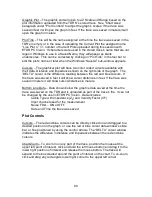
Graphic Plot – The graphic plot will open to a Z Scale and Range based on the
plot information uploaded from the TDR’S’s stored trace. See “Chart Axes”
paragraph under “Plot Controls” to adjust the graph’s scales. If the trace was
saved in feet it will open the graph in feet. If the trace was saved in meters it will
open the graph in meters.
Plot Title – This will be the name assigned at the time the trace was saved in the
TDR’s memory or in the case of uploading the Current Plot the assigned name
“Live Plot n.” n = number of Current Plots uploaded during this session with
ETDR PC Vision. If characters were used in the stored trace’s name that are not
legal in Windows to use in a Saved Name, they will appear as blank
underscores. This can be corrected by clicking on “Plot Title” in the tool bar to
edit the plot’s name or later when the Windows “SaveAs” sub-window appears.
Cursors – The graphical plot will have two color coded cursors available with
their data, Distance and Impedance shown on the right side of the graph. The
“DELTA” cursor is the difference reading between the red and blue cursors. If
the trace was saved in feet it will show cursor distances in feet. If the trace was
saved in meters it will show cursor distances in meters.
Bottom Line Data – Data shown below the graph is data saved at the time the
trace was saved on the TDR and is uploaded as part of the trace’s file. It can not
be changed by the user in ETDR PC Vision. Data includes:
Cable Type with Impedance (Z
0
) and Velocity Factor (VF)
Input channel used for the measurement
Noise Filter – ON or OFF
Date and Time the trace was saved
Plot Controls
Cursors – The red and blue cursors can be directly clicked on and dragged to a
desired position on the graph, or use the red or blue cursor data window’s slide
bar, or fine positioned by using the control arrows. The “DELTA” cursor window
indicates the difference in distance and impedance between the red and blue
cursors.
Chart Zoom – To zoom in on any part of the trace, position the mouse at the
upper left point of interest, click and hold the left mouse button and drag it to the
lower right position of interest and release the mouse button. The trace will
expand to the box created around the point of interest on the chart. To un-zoom,
click and drag any rectangle’s lower right corner to the upper left corner.

