


91
Chart Tool Bar
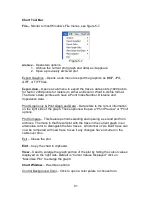
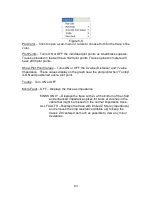
File – Similar to most Window’s File menus, see figure 5-7.
Figure 5-7
Archive – Opens two options:
1. Archive the current plot (graph and data) as it appears.
2. Open a previously archived plot
Export Graphics – Opens a sub menu to export the graphics as BMP, JPG,
GIFF, or TIFF files.
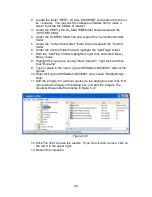
Export Data – Opens a sub-menu to export the trace’s data points (1920 points
for feet or 2000 points for meters) to either an Excel or Word in.xls file format.
The trace’s data points each have a Point Index Number, Distance and
Impedance data.
Print Graph only & Print Graph and Data – Data refers to the cursor information
on the right side of the graph. These options will open a “Print Preview” or “Print”
options.
Plot Compare – This feature permits selecting and opening a second plot from
archives. The trace in that file will plot with the trace in the current graph in an
alternative color to distinguish the two traces. A historical or “As Built” trace can
now be compared with new trace to see if any changes have occurred in the
cable over time.
Exit – Closes the plot
Edit – Copy the chart to clipboard.
View – Used to enlarge the graph portion of the plot by hiding the cursor values
displayed on the right side. Default is “Cursor Values Displayed” click on
“Maximize Plot” to enlarge the graph.
Chart Window – Has three options:
Control Background Color – Click to open a color palate to choose from.


