36
3.4.2.4. History diagram
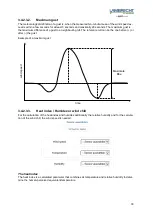
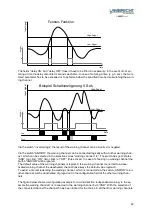
The history diagram continuously shows the course of the measured parameters.
At a change of day this will be displayed via a vertical line and over the time scale. The values are
concentrated to keep the data volume small.
The measured value axis adapts itself automatically in the scaling of the actual displayed measured
values.
The quantity of the possible history diagrams is limited due to the limited internal memory.
3.4.2.5.
Trend display
The trend display is part of the history diagrams and the numerical displays.
For the trend calculation the time base has to be adjusted. 10 minutes, 30 minutes, 1 hour and 3
hours can be chosen. If the trend is deactivated, the trend display accordingly won’t be displayed. The
trend calculation takes places according to the aPPPP calculation.
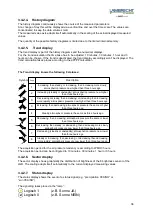
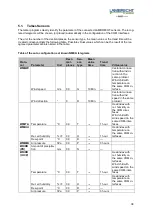
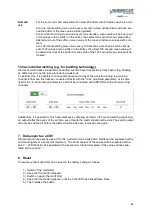
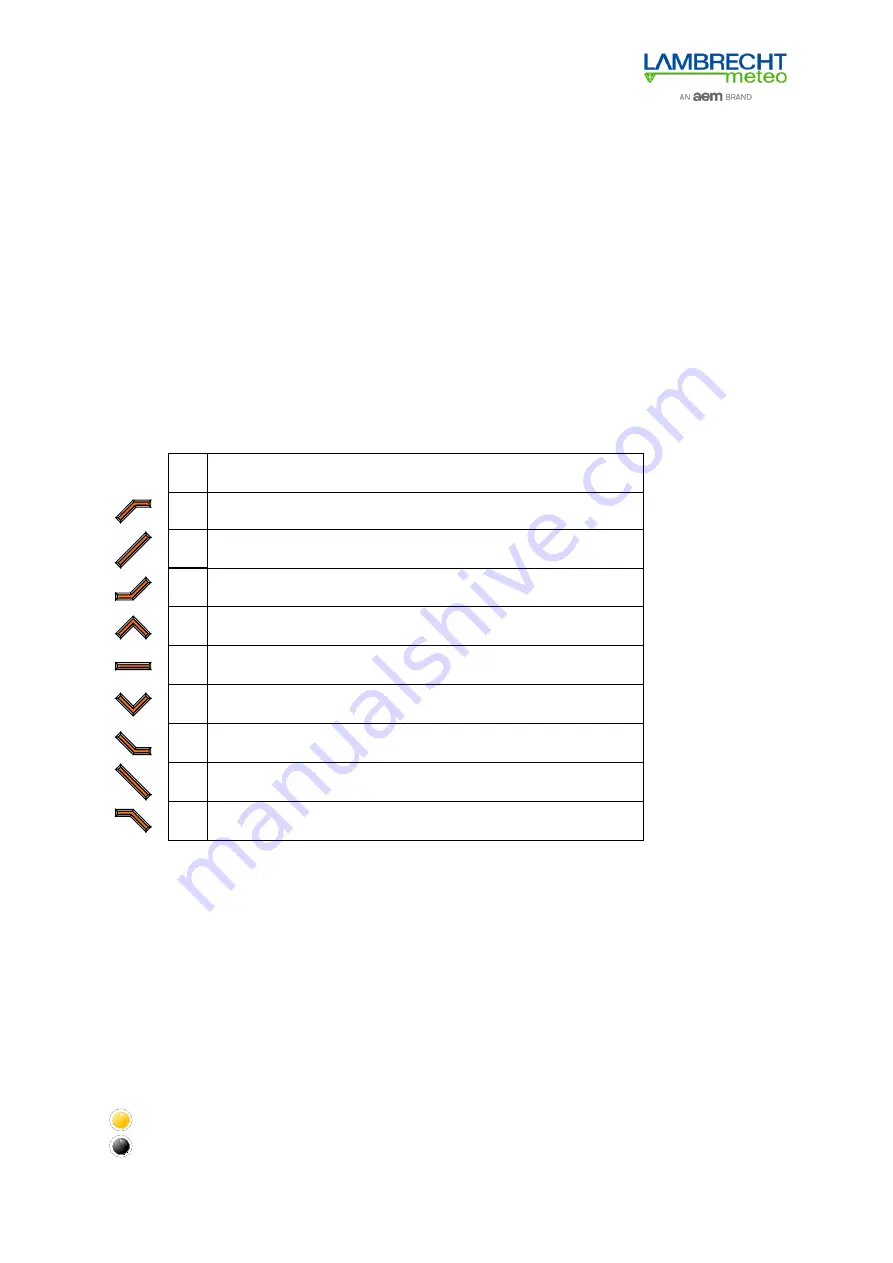
The Trend display knows the following 9 statuses:
2
1
4
3
6
5
8
7
Increasing (steadily or unsteadily); atmospheric pressure now higher
than three hours ago
Increasing, then steady; or increasing, then increasing more slowly;
atmospheric pressure now higher than three hours ago
Steady; atmospheric pressure the same as three hours ago
Decreasing or steady, then increasing; or increasing then increasing
more rapidly; atmospheric pressure now higher than three hours ago
Decreasing, then steady; or decreasing, then decreasing more slowly;
atmospheric pressure now lower than three hours ago
Decreasing, then increasing; atmospheric pressure the same or lower
than three hours ago
Steady or increasing, then decrasing; or decreasing then decreasing
more rapidly; atmospheric pressure now lower than three hours ago
Decreasing (steadily or unsteadily); atmospheric pressure now lower
than three hours ago
0
Increasing, then decreasing; atmospheric pressure the same or hgher
than three hours ago
Code
Description
Symbol
The acquisition period for the air pressure tendency is according to WMO 3 hours.
The acquisition period can be configured to 10 minutes, 30 minutes, 1 hour or 3 hours.
3.4.2.6. Sector display
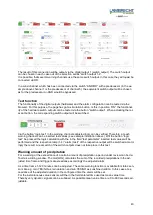
The sector display shows graphically the distribution of brightness of the 8 brightness sensor of the
LGR. The scaling adapts itself automatically to the current displayed measuring values.
3.4.2.7. Status display
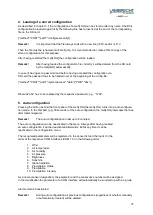
The status display shows the event of a status signal (e.g. “precipitation YES/NO“ or
“sun YES/NO“).
The signalling takes place via the “lamp“:
Logisch 1
(z.B. Sonne JA)
Logisch 0
(z.B. Sonne NEIN)

