72
Sentinel
™
Data Loggers
Sentinel
™
Data Loggers
73
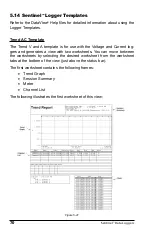
Trend Graph Frame
A Trend Graph frame provides a graphical look into the database it is
attached to. The database is attached to the Trend Graph frame when it
is created.
This frame provides additional tools for viewing the underlying database.
These tools provide zoom and pan operations. In addition, individual
traces and waveform snapshots can be selected using the Select Frame
tool.
Normally, the Select Frame tool is used to select a frame for modification.
In addition to selecting the Graph frame, this tool can be used to select
individual traces. A trace is selected if any part of it is drawn within a few
screen pixels of where the selection tool is when the left mouse button is
pressed.
When a trace is selected, handles similar to those of the frame handles are
drawn over the trace. If more than one trace is drawn within the proximity
of the selection tool, when clicked again, the next trace will be selected.
This will continue until all traces within the selection tools proximity have
been selected. At which point, clicking the left mouse button again will
select the first trace and the process will repeat.
The Trend Graph frame can be the parent frame for child frames. Child
frames are objects that are tightly connected to another (parent) frame.
The child frame obtains instructions, and displays data from the parent.
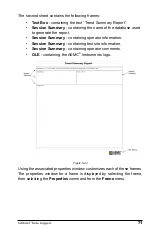
This template contains the following child frame types:
•
Session Summary
•
Channel List
•
Meter
The channels selected for display and the display properties, can be
changed at any time using the Channel Graph Properties window. The
Channel Graph Properties window can be displayed by right-clicking the
mouse pointer while positioned over the Graph frame. Then, select
Prop-
erties
from the popup menu.
The display extents of the Trend Graph frame can be changed by using
zoom and pan operations. By zooming and panning you change the start-
ing and ending times of the displayed data. By changing the starting and
ending display times, you can zoom in, zoom out, pan left and right, pan to
start and pan to end of measurement data.
To change the display extents of a graph frame, select the frame using
either the frame selection tool
or Zoom Tool
. Next, use a zoom or
pan command from the Zoom menu, or from the toolbar. By clicking and

