64
Sentinel
™
Data Loggers
5.11 Displaying a Real-time Trend Graph
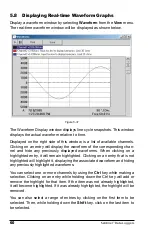
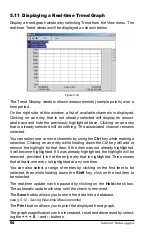
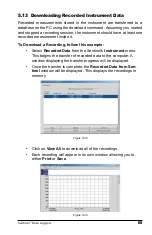
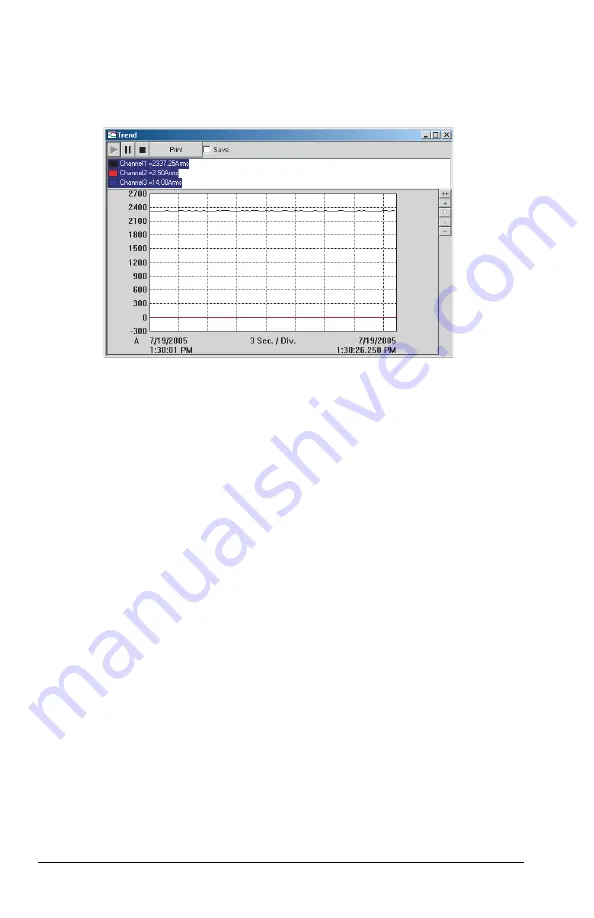
Display a trend graph window by selecting Trend from the View menu. The
real-time Trend window will be displayed as shown below.
Figure 5-34
The Trend Display window shows measurements (sample points) over a
time period.
On the right side of this window, a list of available channels is displayed.
Clicking on an entry that is not already selected will display its associ-
ated trace and hide the previously highlighted trace. Clicking on an entry
that is already selected will do nothing. The associated channel remains
selected.
You can select one or more channels by using the
Ctrl
key while making a
selection. Clicking on an entry while holding down the Ctrl key will add or
remove the highlight for that item. If the item was not already highlighted,
it will become highlighted. If it was already highlighted, the highlight will be
removed, provided it is not the only entry that is highlighted. This ensures
that at least one entry is highlighted at any one time.
You can also select a range of entries by clicking on the fi rst item to be
selected, then while holding down the
Shift
key, click on the last item to
be selected.
The real-time update can be paused by clicking on the
Hold
check box.
The automatic update will stop until the check is removed.
The
Save
button allows you to store the data into a database.
(see § 5.12 - Saving Real-time Measurements)
The
button allows you to print the displayed trend graph.
The graph magnifi cation can be increased, reset and decreased by select-
ing the
++
,
+
,
0
,
-
and
--
buttons.

