114
Agilaire 8872 Manual
Chapter 4 Reports
Monthly Report
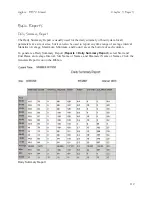
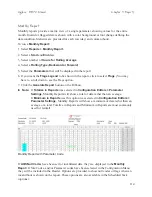
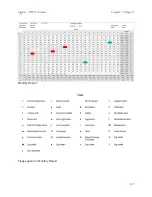
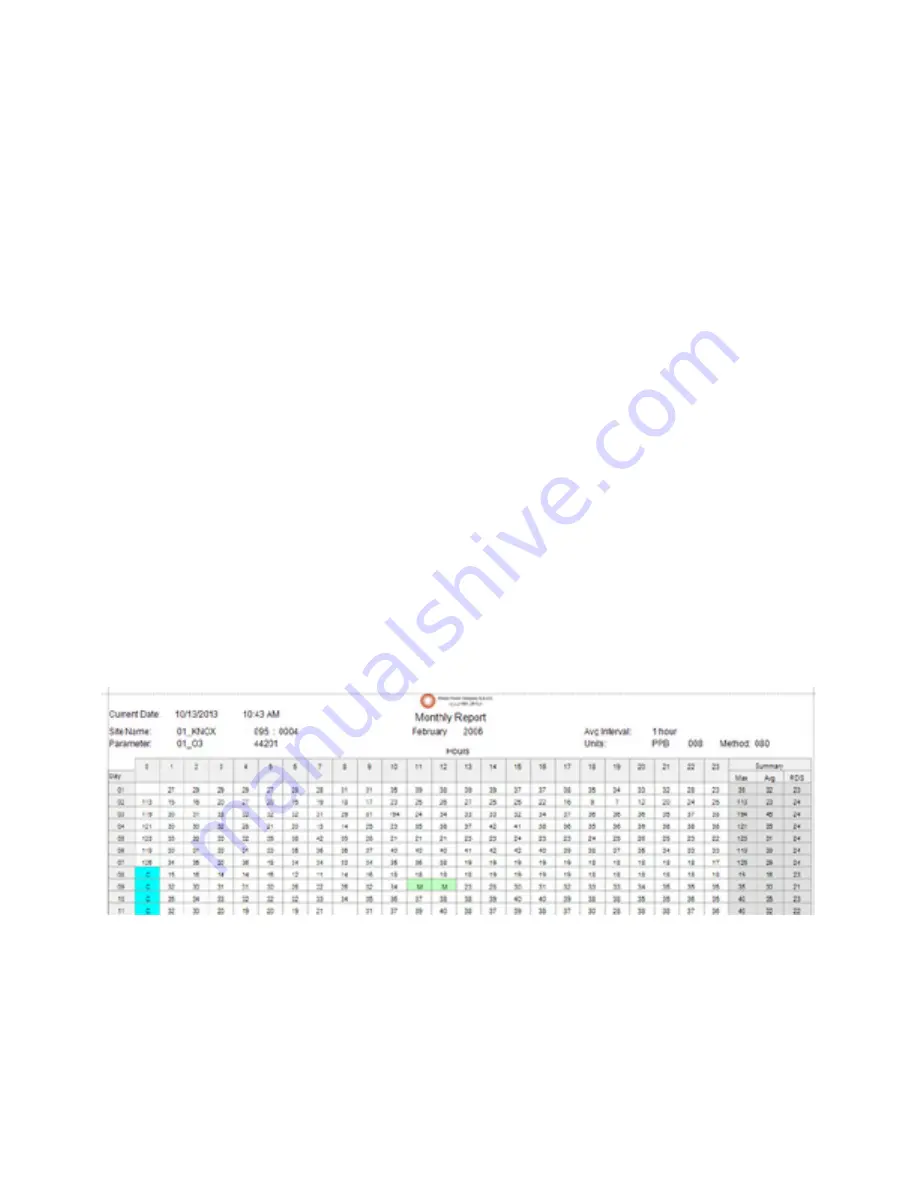
Monthly reports provide a matrix view of a single parameter, showing values for the entire
month. Invalid or flagged data is shown with a color background or font change defining the
data condition. Statistics are provided for each row (day) and column (hour).
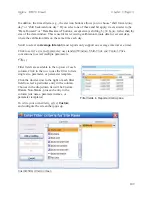
To run a
Monthly Report:
1.
Select
Reports > Monthly Report.
2. Select a
Start
and
End
date
3. Select number of
Hours for Rolling Average
4. Select a
Rolling Type
(
Backward or Forward
)
5. Select the
Parameters
that will be displayed in the report
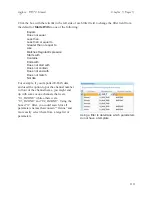
6. If you want the
Flags Legend
to be shown in the report, click to select
Flags
. (You may
have to scroll down to see the Flags option.
7. Click the
Generate Report
button on the Ribbon.
Note:
If
Totalize in Reports
was
selected in
Configuration Editors > Parameter
Settings
, Monthly Reports will show a total of data rather than an average.
If
Minimum in Reports
was this option was selected in
Configuration Editors >
Parameter Settings
, Monthly Reports will show a minimum of data rather than an
average or a total. Totalize in Reports and Minimum in Reports are most commonly
used for rainfall.
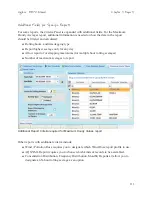
Monthly Report with Parameter Code
If
AQS Null Code
s have been set for invalidated data, they are displayed in the
Monthly
Repor
t. If Site Codes, and/or Parameter codes have been selected in the Configuration Menu
they will be included in the Header. Options are provided to show null codes or flags when an
invalid hour is shown on the report. These options are also available in the Scheduled Task
(options).

