143
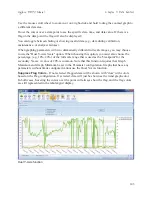
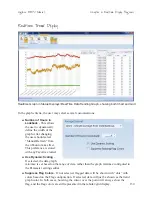
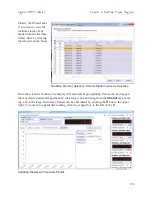
Use the mouse scroll wheel to zoom in or out; right-click and hold to drag the zoomed graph to
a different data area.
Hover the cursor over a data point to see the specific date, time, and data value. If there is a
flag on the data point the flag will also be displayed.|
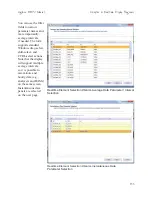
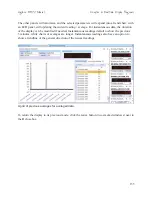
You can toggle between hiding or showing invalid data (e.g., data during calibration,
maintenance, or analyzer failures).
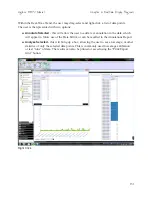
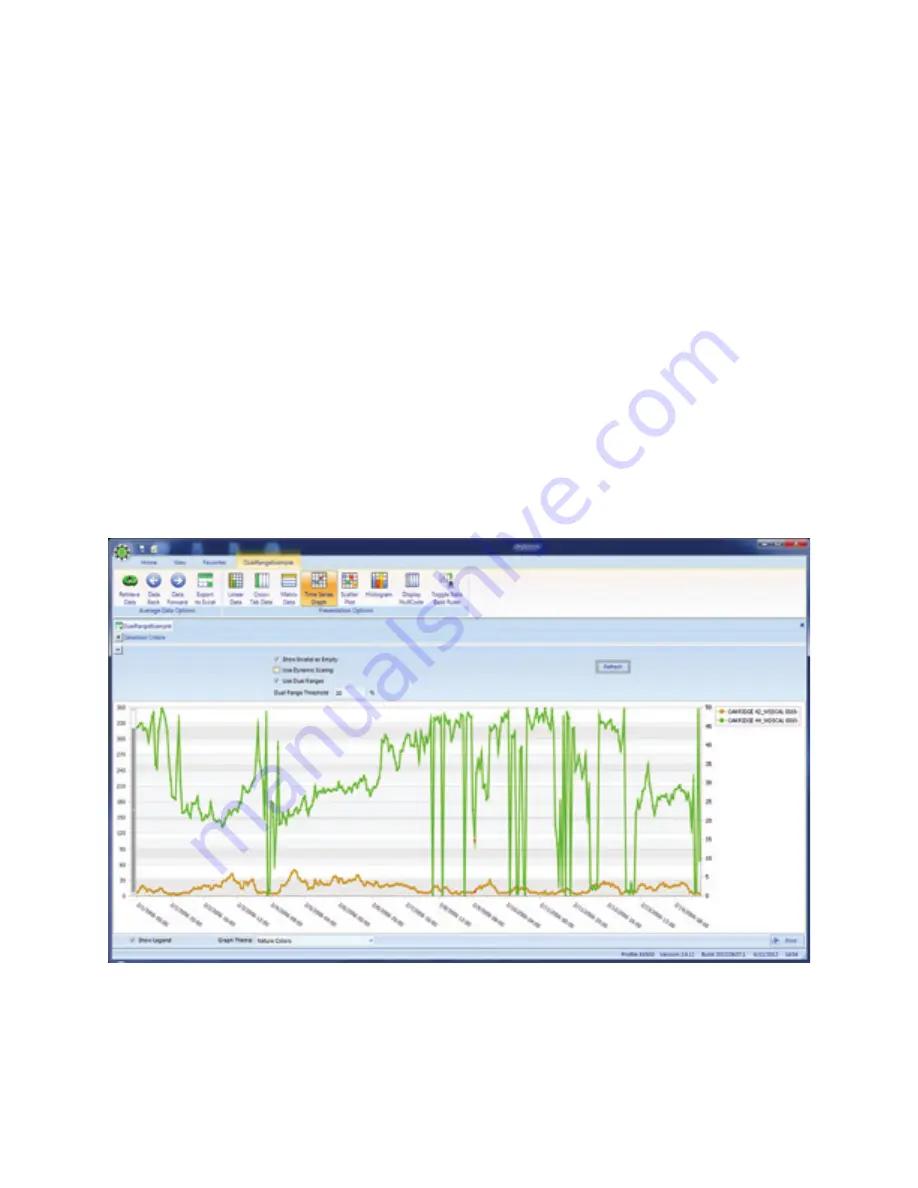
When graphing parameters with two dramatically different full scale ranges, you may choose
to use the "Dual Y-Axis Scale" option. When choosing this option, you must also choose the
percentage (e.g., 10%, 20%) of the full scale range that is used as the 'breakpoint' for the
secondary Y-axis. A value of 20% is common. Note that this function requires that Graph
Maximum and Graph Minimum be set in the Parameter configuration. Graphs that have any
parameters without limits configured cannot use the Dual Y-Axis function.
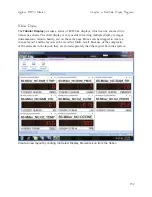
Suppress Flag Colors
- If not selected, flagged data will be shown with “dots” with colors
based on the Flag configuration. If selected, data will just be shown as the trend graph color.
In both cases, hovering the cursor over the point will always show the flag, and the flag colors
are still represented in the tabular/grid display.
Agilaire 8872 Manual
Chapter 5 Data Editors
Dual Y-Axis function


