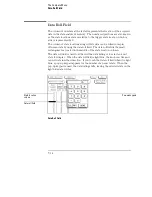
Axis Control Field
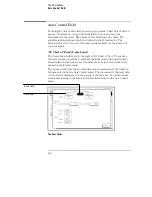
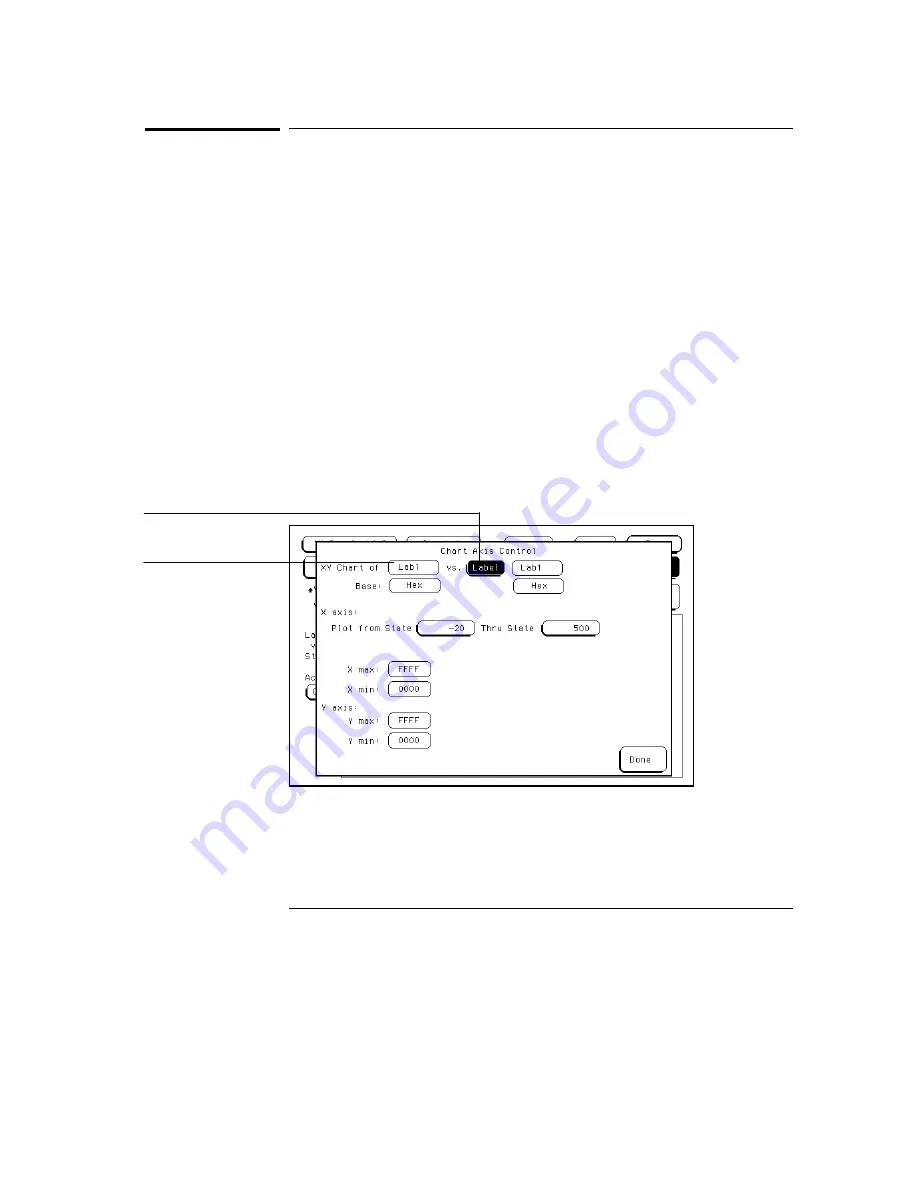
Touching the Axis Control field causes a pop-up menu, Chart Axis Control, to
appear. In this menu, you specify the relation to be charted and the
boundaries for the chart. The vertical Y axis will always be a label. The
available labels are those which you defined in the Format menu. The
horizontal X axis can be one of the same labels available for the Y axis or it
can be samples.
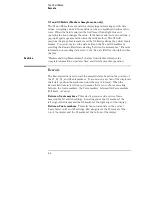
"XY Chart of" Field (Y-axis Label)
The Y-axis Label field is just to the right of "XY Chart of" text. To specify a
vertical axis label, touch the Y-axis Label field then select the desired label
from the label list pop-up menu. The label choices are the labels that were
defined in the Format menu.
The values charted are the acquired data value represented by that label, in
the base selected in the Axis Control menu. The placement of the label data
on the chart is determined by the scaling of the two axes. You select values
for the axes scaling in the X-axis and Y-axis fields found in the Axis Control
menu.
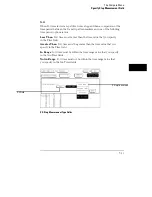
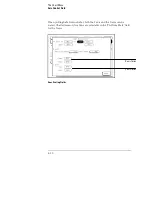
The Axes Fields
Y-axis field
X-axis field
The Chart Menu
Axis Control Field
8–8
Summary of Contents for 16517A
Page 3: ...The Agilent Technologies 16517A 4 GSa S Timing and 1 GSa S State Logic Analyzer ii ...
Page 5: ...iv ...
Page 11: ...Contents 6 ...
Page 12: ...1 General Information ...
Page 18: ...2 Probing ...
Page 29: ...2 12 ...
Page 30: ...3 The Format Menu ...
Page 42: ...4 The Trigger Menu ...
Page 79: ...4 38 ...
Page 80: ...5 The Listing Menu ...
Page 86: ...6 The Waveform Menu ...
Page 106: ...7 The Compare Menu ...
Page 122: ...8 The Chart Menu ...
Page 133: ...8 12 ...
Page 134: ...9 Markers and Stop Measurements ...
Page 149: ...9 16 ...
Page 150: ...10 Skew Adjust ...
Page 156: ...11 Error Messages ...
Page 165: ...11 10 ...
Page 166: ...12 Specifications and Characteristics ...
Page 176: ...13 Installation and Service ...
Page 189: ...13 14 ...
Page 193: ...Index 4 ...

