89
Chapter 2: Task Guide
Displaying Captured Data
Waveform and Listing (and other) display tools provide global markers
that can be used to correlate data that is captured by different
instrument modules or displayed differently in other display tool
windows.
The Waveform and Listing display tools also give you the ability to
search for particular data values captured on labels.
Listing displays let you load inverse assemblers that will decode
captured data into assembly language mnemonics. From the Listing
display, you can also open Source Correlation Toolset (Source Viewer)
windows that can display the high-level language source code that is
associated with captured data.
See Also
Using the Digital Waveform Display Tool (see the
Waveform Display Tool
help volume)
Using the Listing Display Tool (see the
Listing Display Tool
help volume)
Working with Markers (see the
Markers
help volume)
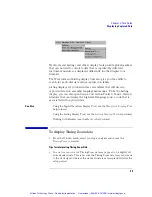
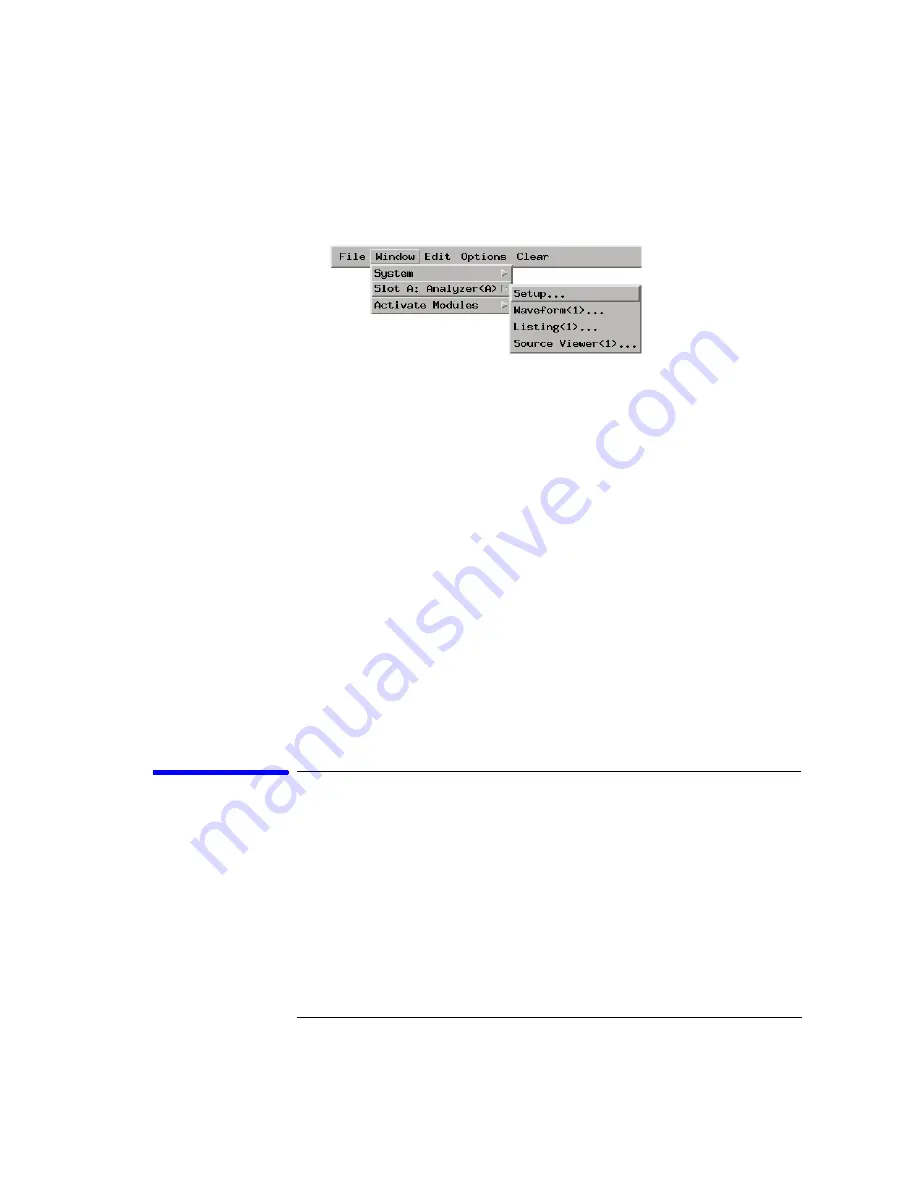
To display Timing Zoom data
1. From the Window menu, select your logic analyzer and choose the
TimingZoom
command.
Tips for interpreting Timing Zoom Data
•
In a
state measurement
, Timing Zoom data may appear to be slightly off
from standard data. This is because the Timing Zoom data is asynchronous
to the clock signal, whereas the standard data is not sampled until after the
setup period.
Artisan Technology Group - Quality Instrumentation ... Guaranteed | (888) 88-SOURCE | www.artisantg.com

