Display
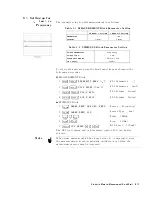
Annotations
The
settings
that
you
set
in
the
previous
section
are
displayed
on
the
LCD
as
annotations
.
The
annotations
are
described
below
.
V
erify
that
they
are
set
correctly
.
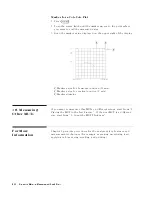
1
measurement
parameter
for
channel
1
2
measurement
parameter
for
channel
2
3
stimulus
start
value
4
stimulus
stop
value
5
OSC
level
value
(frequency
,
dc
bias
sweep
only)
6
CW
frequency
(OSC
Level,
dc
bias
sweep
only)
7
dc
bias
value
(option
001
only)
8
grid
scale
(you
do
not
have
set
the
scale
in
the
previous
section).
T&B
x,
y
(for
log,
linear
format)
The
value
of
the
top
of
grid
is
x .
The
value
of
the
bottom
of
grid
is
y .
z
/
REF
xx
(for
linear
format)
The
scale/div
value
is
z .
The
value
of
the
reference
position
at
which
the
7
9
locates
is
xx .
Note
The
analyzer
has
two
channels
that
provide
independent
measurement
and
display
of
the
data.
The
traces
and
grids
of
the
two
channels
are
displayed,
one
over
the
other
.
The
4
Chan
1
5
and
4
Chan
2
5
keys
(in
the
A
CTIVE
CHANNEL
block)
select
which
channel
is
activated.
All
the
channel
specic
functions
that
are
selected
apply
to
the
active
channel.
When
you
want
to
display
the
trace
of
either
channel
1
or
2,
toggle
NNNNNNNNNNNNNNNNNNNNNNNNNNNNNNNNNNNNNNNNNNNNNNNNNN
DUAL
CHAN
ON
off
to
NNNNNNNNNNNNNNNNNNNN
on
OFF
under
4
Displa
y
5 ,
and
then
select
4
Chan
1
5
or
4
Chan
2
5
Jump
to
\9.
Measuring
the
MUT"
4-18
Dielectric
Material
Measurement
Quick
Start
Summary of Contents for 4291B
Page 20: ......
Page 24: ...Figure 2 1 Contents 2 4 Installation and Set Up Guide ...
Page 26: ...Figure 2 2 Agilent Part Numbers of Power Cables 2 6 Installation and Set Up Guide ...
Page 34: ...Figure 2 7 Connecting a Keyboard 2 14 Installation and Set Up Guide ...
Page 60: ......
Page 104: ......
Page 130: ......
Page 152: ......
Page 158: ......


