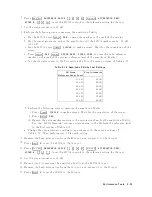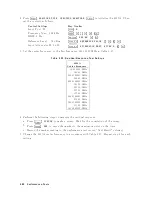
w.
Repeat
steps
1-h
through
1-m
to
remov
e
the
p o
w
er
splitter
tracking
c
haracteristic.
Record
the
4395A
marker
reading
and
p o
w
er
meter
reading
in
the
in
\ 4395A
Reading
2"
and
\P
o
w
er
Meter
Reading
2"
columns
of
the
calculation
sheet.
x.
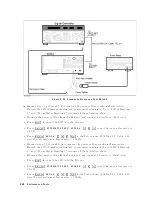
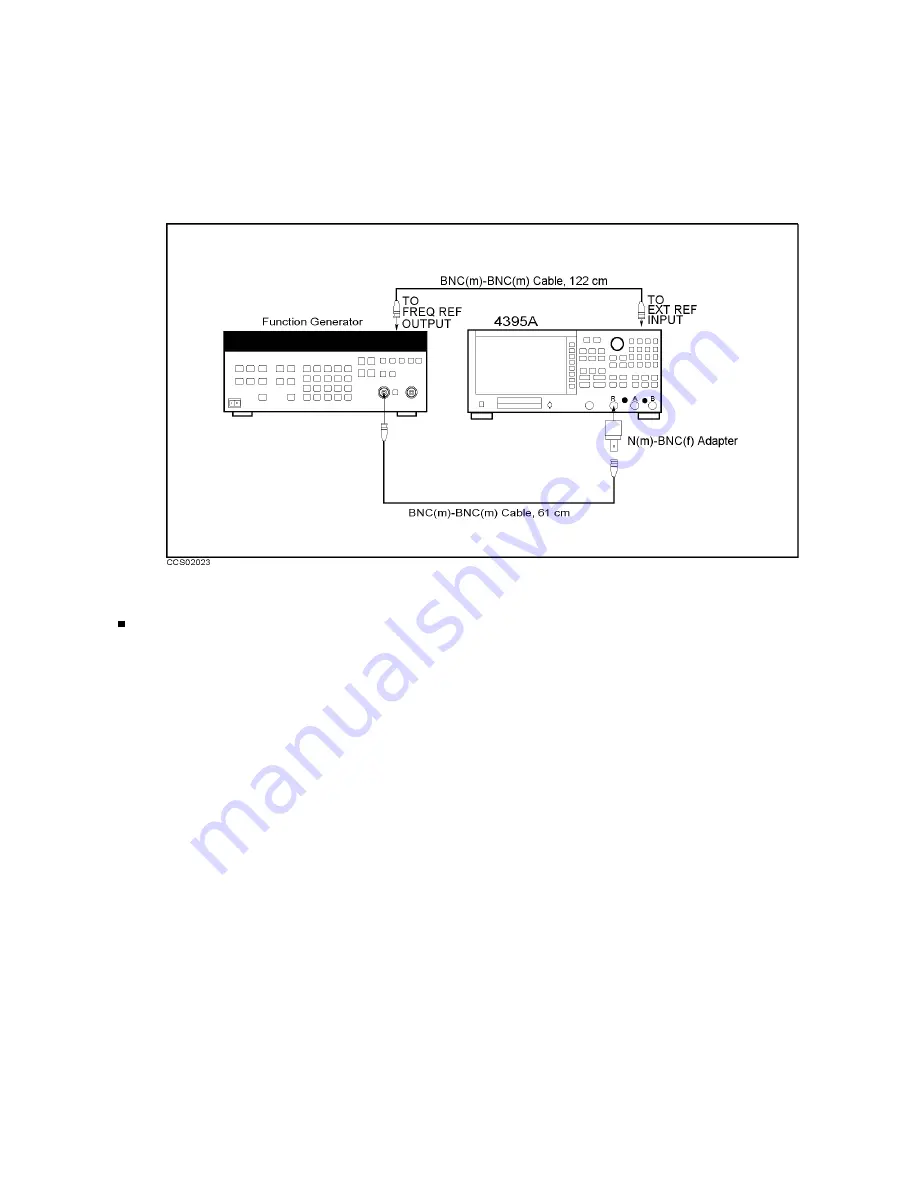
Change
the
test
equipmen
t
setup
as
sho
wn
in
Figure
2-26.
Figure
2-26.
Frequency
Response
T
est
Setup
3
F
or
testing
low
frequencies
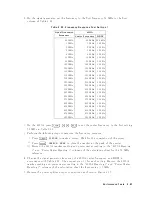
1.
Initialize
the
function
generator.
Then
set
the
amplitude
to
020
dBm.
2.
On
the
function
generator,
set
the
frequency
to
the
rst
test
frequency
10
Hz
in
the
rst
column
of
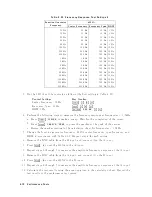
T
able
2-23.
T
able
2-23
lists
the
test
settings
at
frequencies
<
1
MHz.
P
erformance
T
ests
2-69
Summary of Contents for 4395A
Page 10: ......
Page 26: ......
Page 34: ......
Page 77: ...Figure 2 17 B R Magnitude Ratio Phase Dynamic Accuracy Test Setup 2 Performance Tests 2 43 ...
Page 167: ...Figure 5 1 Adjustment Hardware Setup Adjustments 5 5 ...
Page 186: ...Figure 5 13 Receiver Gain Adjustment Location 5 24 Adjustments ...
Page 190: ...Figure 5 16 Receiver Flatness Adjustment Setup 1 MHz 5 28 Adjustments ...
Page 194: ...Figure 5 20 DC Bias Adjustment Setup 2 5 32 Adjustments ...
Page 196: ...Figure 6 1 Troubleshooting Organization 6 2 Troubleshooting ...
Page 206: ...Figure 7 1 Power Supply Lines Simplified Block Diagram 7 2 Power Supply Troubleshooting ...
Page 212: ...Figure 7 5 A1 CPU Connector Locations 7 8 Power Supply Troubleshooting ...
Page 220: ...Figure 8 1 Digital Control Group Simplified Block Diagram 8 2 Digital Control Troubleshooting ...
Page 240: ...Figure 10 1 Top View Major Assemblies 10 4 Replaceable Parts ...
Page 292: ...Table A 2 Manual Changes by Firmware Version Version Make Manual Changes A 2 Manual Changes ...
Page 308: ......
Page 311: ...Figure B 1 Power Cable Supplied Power Requirement B 3 ...
Page 312: ......
Page 342: ......

