Agilent 86038B Photonic Dispersion and Loss Analyzer, Second Edition
129
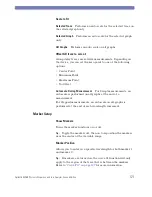
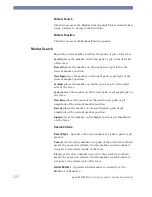
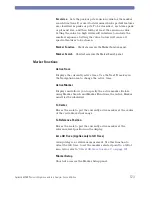
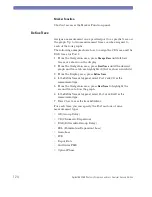
Navigating the Front Panel
Change View
Displays one, two, or four graphs sequentially as Change View is
pressed. Multiple graph views show a combination of ports and
measurement traces at the same time. Refer to
to define each graph with specific measurement
traces.
To make a particular graph full screen, activate the desired
trace using the Next Trace key and then press Change View until
just that one graph is displayed.
Next Trace
Activates each graph trace in a sequential manner each time the
Next Trace key is pressed. If one graph is displayed, repeated
key presses selects one trace and then the other. If two or more
graphs are displayed, repeated key presses select each trace in a
sequential order.
Use Next Trace to make any changes to the Display area
functions. That is, X Scale, Y Scale, Auto Scale, Marker Setup,
Marker Search, Define Trace, Smoothing, or Curve Fit. These
functions are defined specifically for each trace.
Summary of Contents for 86038B
Page 1: ...Agilent 86038B Photonic Dispersion and Loss Analyzer User s Guide ...
Page 4: ...4 ...
Page 20: ...20 Agilent 86038B Photonic Dispersion and Loss Analyzer Second Edition ...
Page 34: ...34 Agilent 86038B Photonic Dispersion and Loss Analyzer Second Edition Figure 2 b Rear Panel ...
Page 78: ...78 Agilent 86038B Photonic Dispersion and Loss Analyzer Second Edition ...
Page 92: ...92 Agilent 86038B Photonic Dispersion and Loss Analyzer Second Edition ...
Page 202: ...202 Agilent 86038B Photonic Dispersion and Loss Analyzer Second Edition End Sub ...
Page 348: ...348 Agilent 86038B Photonic Dispersion and Loss Analyzer Second Edition ...
Page 349: ......

