7-64
Chapter 7
Programming Examples
Measurement Data Transfer Examples
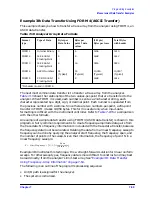
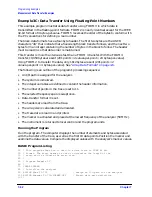
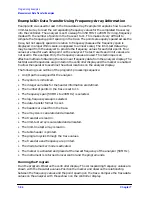
Example 3D: Data Transfer Using Frequency-Array Information
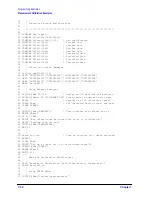
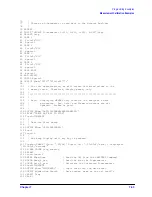
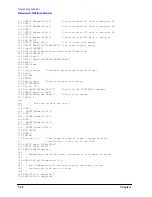
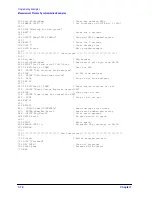
Example 3C was used to read in the trace-data array. Example 3D explains how to use the
limit-test array to read the corresponding frequency values for the completed trace array
into the controller. The analyzer is set to sweep from 50 MHz to 200 MHz in log-frequency
mode with the number of points in the trace set to 11. This makes it very difficult to
compute the frequency-point spacing in the trace. The points are equally spaced across the
trace, but not equally spaced in relation to frequency (because the frequency span is
displayed in a logarithmic scale, as opposed to a linear scale). The limit-test data array
may be read from the analyzer to provide the frequency values for each data point. Four
values are read for each data point on the analyzer. The test results and limit values are
not used in this example. Only the frequency values are used. This technique is an
effective method of obtaining the non-linear frequency data from the analyzer display. The
test data and frequencies are printed on the controller display and the marker is enabled
to allow the operator to examine the actual locations on the analyzer display.
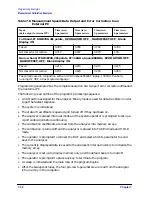
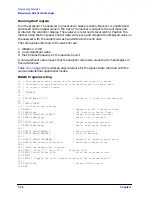
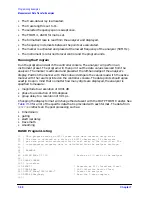
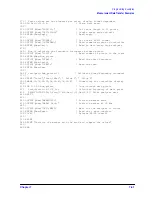
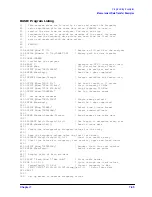
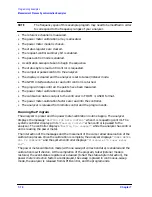
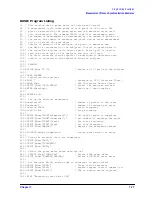
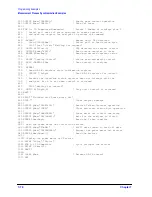
The following is an outline of the program's processing sequence:
• An I/O path is assigned for the analyzer.
• The system is initialized.
• The integer variables for the header information are defined.
• The number of points in the trace is set to 11.
• The frequency span (50 MHz to 200 MHz) is selected.
• The log-frequency sweep is selected.
• The data-transfer format 3 is set.
• The headers are read from the trace.
• The array size is calculated and allocated.
• The trace data is read in.
• The limit-test array is calculated and allocated.
• The limit-line test array is read in.
• The table header is printed.
• The program cycles through the trace values.
• The trace data and frequency are printed.
• The discrete-marker mode is activated.
• The marker is activated and placed at the lowest frequency of the analyzer (50 MHz).
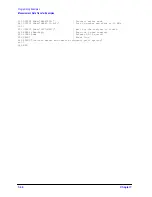
• The instrument is returned to local control and the program ends.
Running the Program
Run the program. Observe the controller display. The corresponding frequency values are
shown with the trace-data values. Position the marker and observe the relationship
between the frequency values and the point spacing on the trace. Compare the trace-data
values on the analyzer with those shown on the controller display.
Summary of Contents for 8719ES
Page 15: ...1 1 1 Alphabetical Command Reference ...
Page 293: ...2 1 2 Introduction to Instrument Control ...
Page 310: ...3 1 3 GPIB Programming ...
Page 334: ...4 1 4 Reading Analyzer Data ...
Page 343: ...5 1 5 Data Processing Chain ...
Page 350: ...6 1 6 Error Reporting ...
Page 364: ...7 1 7 Programming Examples ...
Page 502: ...A 1 A Preset Conditions ...
Page 517: ...B 1 B Command Listings ...

