background image

©  2013  Agilent Technologies  

Aerospace & Defense Symposium 

37 

©  2013  Agilent Technologies  

Aerospace & Defense Symposium 

Start With Problem/Need, Choose Best Tool 

Swept Spectrum Analyzer 

(especially with digital IF) 

• Familiar meas, user interface; compatible with established std’s, practices 
• Frequency flexibility including span, RBW, VBW 
• Maximum accuracy, dynamic range, sensitivity 
• Measurement flexibility:  phase noise, noise figure, ACPR, EMI, apps, etc. 

Real Time Analyzer 

• Find elusive signals, some ability to characterize (spectrogram, PVT) 
• Spot unknown signals, signal behavior 
• Monitor spectrum, trigger on spectral behavior 

Vector Signal Analyzer (VSA software on signal analyzer platform) 

• Detailed vector analysis and demodulation 
• Signal capture, flexible playback 
• Post-processing for signal selection, re-use 
• Single user interface for multiple hardware platforms, multi-channel 

analysis 

Modern Signal Analyzer Hardware May Support All Three 

Summary of Contents for Agile or Elusive Signals Using

Page 1: ... 2013 Agilent Technologies Aerospace Defense Symposium Analyze Agile or Elusive Signals Using Real time Measurement and Triggering ...

Page 2: ...Signals Discovering Signals vs Troubleshooting Optimizing Case Studies Dynamic signal environment ISM band Radar signal Choosing Using Techniques Tools Make the most of what you already know own Swept spectrum analyzers Vector signal analyzers VSA software Oscilloscopes Real time analyzers Using Triggering to Enhance Measurement Effectiveness ...

Page 3: ...pread Spectrum Techniques Lightly Regulated Signals Not Explicitly Coordinated WLAN typically dominant occupant Bluetooth Cordless Phones And 1 kW microwave ovens And almost anything else Very Dynamic Content not known at any specific point in time Often very low occupancy Lots of Collision Tolerance Needed Potential Cliff Effect at Some Degree of Crowding ...

Page 4: ...lysis Band 100 MHz Span 160 MHz Dynamics X2 swept RBW changing signals Confuse the View Peak Hold Detects Signals but Frequency Overlap Obscures Signals Typically Short Duty Cycle Total Low Occupancy POI is Approximately Low useful concept even if not strictly applicable Single Sweep fast but retrace not as fast Peak Hold short Peak Hold long ...

Page 5: ...Symposium ISM Band View Real Time Analyzer Density or Histogram Display Gap Free Analysis No Signals Missed Density Display Shows Signals Inside Signals Fast Full Display Update Rate Shows Signal Dynamics See Unexpected Behavior Even If Infrequent Individual Display Updates Combine Thousands of Spectra ...

Page 6: ...trogram Display Top Trace is Latest or Selected Spectrum Same Spectral Data as Density Histogram Individual Spectrogram Line Represents Many Spectra typically thousands View into Dynamics Timing Acquisition Time Setting Affects Way Spectra are Combined to Form Display Update WLAN Signals Active Continuously What are Vertical Bars A Multitone Signal ...

Page 7: ...ition Time Shorter Acquisition Time Determines Amount of Data Processed for Spectrum or Spectrogram Trace Update Each Trace Update Spectrogram Line Represents Fewer Spectra More Trace Updates Second Finer Time Resolution Spectrogram Covers Shorter Interval Determines Time Scale of Spectrogram Use Spectrogram Trace Buffer to Examine Signal Dynamics ...

Page 8: ...ty View Fast Display Updates High Data Density Easily Understand Signal or Event Frequency Find Very Infrequent Events Find Unexpected Events Behavior Limitations Combining traces combines behavior from different times Limited flexibility RBW span combinations Limited frequency span Power spectrum only Markers only on combined spectrum or density at a point ...

Page 9: ...nt results of some kind usually spectrum Real Time Bandwidth RTBW The widest analysis bandwidth where an analyzer can maintain real time operation Duration of maintaining real time operation is not specified it may assumed to be short term or long term or unlimited Current Usage for Signal Analyzers A spectrum or FFT analyzer having a signal processing path where most or all samples even at wide b...

Page 10: ...t Technologies Aerospace Defense Symposium Real Time Operation In Real Time Operation the Analyzer s Processing CALC is Fast Enough to Keep Up with All Data Samples CALC Time Includes FFT or Power Spectrum Averaging Display Updates etc However some data may still be lost ...

Page 11: ...Defense Symposium If Processing is Faster than Sampling Perform Additional FFTs With Partially New Time Records as Samples Come In Avoid Loss of Data Due to Windowing Accurate Amplitude Measurements of Short Duration Signals Overlap Processing Overlap 0 Overlap 50 Processor Idle Window Function ...

Page 12: ...ta is processed process is continuous Consistent measurement display update speed all hardware implementation of FFT spectrum generation and not subject to Windows task interruptions High speed measurements many thousands of FFT generated spectra per second vastly exceeding software FFT speed High speed and or data dense displays combine large numbers of measurements to form responsive insight pro...

Page 13: ...Finding signals important to you expected or unexpected Reasonable effort and time to discovery Signals found can be measured as necessary Knowledge of signals may be perfect or simply adequate A More Rigorous Treatment in Paper From Richard Overdorf Understanding Probability of Intercept for Intermittent Signals Evaluate These Techniques Against Your Requirements ...

Page 14: ... Symposium Frequency Mask Trigger FMT Trigger Based on In Band Power scalar Spectrum Spectral Mask Evaluation High Low Limits Logic Trigger Generated from High Speed FFT Engine Trigger Timing Resolution 1 FFT Period Trigger Not Time Aligned Trigger a Single Spectrum Measurement or Time Capture VSA etc ...

Page 15: ...e Symposium Vector Signal Analysis The Logical Extension and Complement to a Real Time Analyzer Superheterodyne Downconversion to All Digital IF Adaptable to swept spectrum analysis and real time analyzer Full vector data preserved Capture Memory Measurements Short Long Data Block Vector Demodulation ...

Page 16: ...ies Aerospace Defense Symposium 16 2013 Agilent Technologies Aerospace Defense Symposium VSA Spectrum of ISM Band Signals Initial Measurement Not Much More Informative FFT Avoids Problem of Moving Analysis Aperture RBW filter ...

Page 17: ...ce Defense Symposium 17 2013 Agilent Technologies Aerospace Defense Symposium VSA Spectrum of ISM Band Signals Long Time Record 100 000 points Much More Informative Higher POI Spectrum Magnitude or RF Envelope Color Persistence Spectrum ...

Page 18: ...m of ISM Band Signals Long Time Record Enhanced Displays Not Real Time with Live Measurements Is Real Time Plus Overlap with Time Capture and Playback Separating History frequency of occurrence and Recency Select Segment Region to Analyze from Time Capture buffer Many Spectra Combined Digital Persistence Cumulative History ...

Page 19: ...Time record length goes up faster than FFT speed goes down Narrow Frequency Span to the Minimum Needed Time record is longer in time for given number of points Use IF Magnitude Trigger Pre Post Delays Holdoff Avoid measuring when no signal present in span Use Persistence or Density History Displays Typically persistence to make peaks last long enough to be noticed Peak Hold Result POI Dramatically...

Page 20: ...s and Real Time Analyzers IF Magnitude Frequency Mask Triggers Triggered Individual Measurements or Signal Captures Sqrt I2 Q2 of each sample is easier faster VSAs FFT power Spectrum is slower but more selective RTSAs VSA now does both Capture Memory Measurements Short Long Data Block Vector Demodulation IF Mag or Freq Mask Trig ...

Page 21: ...a Signal Detailed Signal Analysis Including Vector Demodulation Time Capture Playback Connection to Many Signal Analzyer Front Ends Signal analyzers Oscilloscopes Digitizers Multi Channel Analysis Including Channel Time Alignment Including multi channel capture analysis Beam forming MIMO space time coding Multi Band Analysis Multi Measurements Excellent Complement to Single Channel RTSA ...

Page 22: ...m Agilent 89600B VSA Signal Capture Just Press the Red Button Use Existing Center Span Wider is ok Press Record Then Press Play Adjust Capture if Desired Length seconds samples time records or use default Input Range Frequency Center Span Better Faster Insights from Measuring Same Signal with Different Settings ...

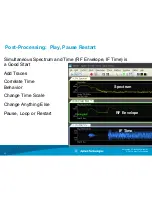
Page 23: ...logies Aerospace Defense Symposium Post Processing Play Pause Restart Spectrum IF Time Simultaneous Spectrum and Time RF Envelope IF Time is a Good Start Add Traces Correlate Time Behavior Change Time Scale Change Anything Else Pause Loop or Restart Spectrum RF Envelope IF Time ...

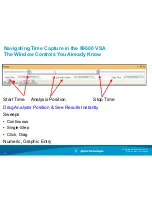
Page 24: ...ent Technologies Aerospace Defense Symposium Navigating Time Capture in the 89600 VSA The Window Controls You Already Know Start Time Analysis Position Stop Time Drag Analysis Position See Results Instantly Sweeps Continuous Single Step Click Drag Numeric Graphic Entry ...

Page 25: ...Symposium 25 2013 Agilent Technologies Aerospace Defense Symposium Control Playback Speed with Overlap How Time Records Step Through Capture Memory Higher Overlap Slower Playback Overlap Adjustable 0 to 99 99 full speed to 1 10 000 speed 50 90 98 ...

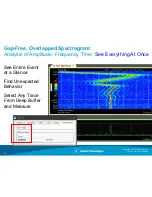
Page 26: ...ium 26 2013 Agilent Technologies Aerospace Defense Symposium Gap Free Overlapped Spectrogram Analysis of Amplitude Frequency Time See Everything At Once See Entire Event at a Glance Find Unexpected Behavior Select Any Trace From Deep Buffer and Measure ...

Page 27: ...3 Agilent Technologies Aerospace Defense Symposium 27 2013 Agilent Technologies Aerospace Defense Symposium Capture and Spectrogram Show Environment Understand Frequency Time Power Modulation Relationships ...

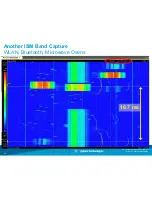
Page 28: ... 2013 Agilent Technologies Aerospace Defense Symposium 28 2013 Agilent Technologies Aerospace Defense Symposium Another ISM Band Capture WLAN Bluetooth Microwave Ovens 16 7 ms ...

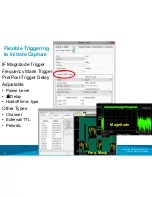
Page 29: ...Agilent Technologies Aerospace Defense Symposium Flexible Triggering to Initiate Capture IF Magnitude Trigger Frequency Mask Trigger Pre Post Trigger Delay Adjustable Power Level Delay Holdoff time type Other Types Channel External TTL Periodic Magnitude Freq Mask ...

Page 30: ...ium RTSA Frequency Mask Trigger in 89601B VSA RT FMT engine free trig mask data RT spect RT histo RT spectro VSA Time Inp Time spectrum demod etc capt Setup window Similar to RTSA Acq IQ time Control Setup window free run RT RT display triggered PXA VSA ...

Page 31: ...es Aerospace Defense Symposium 31 2013 Agilent Technologies Aerospace Defense Symposium Capture Wide Analyze Any Freq Segment Post Capture Span Center Frequency Changes Apply to All Modes including Analog Digital Demodulation ...

Page 32: ... 2013 Agilent Technologies Aerospace Defense Symposium Focus on a Time and Frequency Region Play back until signal appears Click drag analysis region position Marker CF reduce span ...

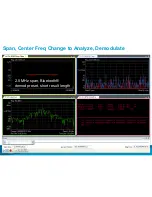
Page 33: ... 2013 Agilent Technologies Aerospace Defense Symposium Span Center Freq Change to Analyze Demodulate 2 5 MHz span Bluetooth demod preset short result length ...

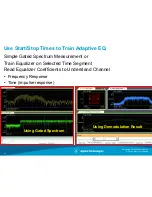
Page 34: ...Aerospace Defense Symposium Use Start Stop Times to Train Adaptive EQ Simple Gated Spectrum Measurement or Train Equalizer on Selected Time Segment Read Equalizer Coefficients to Understand Channel Frequency Response Time impulse response Using Gated Spectrum Using Demodulation Result ...

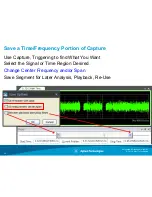
Page 35: ...13 Agilent Technologies Aerospace Defense Symposium Save a Time Frequency Portion of Capture Use Capture Triggering to find What You Want Select the Signal or Time Region Desired Change Center Frequency and or Span Save Segment for Later Analysis Playback Re Use ...

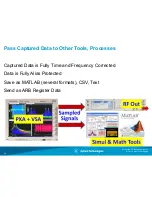
Page 36: ...mposium Pass Captured Data to Other Tools Processes Captured Data is Fully Time and Frequency Corrected Data is Fully Alias Protected Save as MATLAB several formats CSV Text Send as ARB Register Data IF Section Analysis Display Live Meas Playback Downconvert Digitize ADC Capture Memory Trigger Calc RF Out ...

Page 37: ...sitivity Measurement flexibility phase noise noise figure ACPR EMI apps etc Real Time Analyzer Find elusive signals some ability to characterize spectrogram PVT Spot unknown signals signal behavior Monitor spectrum trigger on spectral behavior Vector Signal Analyzer VSA software on signal analyzer platform Detailed vector analysis and demodulation Signal capture flexible playback Post processing f...

Page 38: ...ce Defense Symposium 38 2013 Agilent Technologies Aerospace Defense Symposium Case Study 2 S Band Acquisition Radar Raster Scanning Pulse Width 6 μs PRI 600 μs 7 Pulses 10 MHz Spacing Stepping Low High Frequency Pulses 30 MHz to 30 MHz ...

Page 39: ...ilent Technologies Aerospace Defense Symposium Fast Clear Signal View Blue Indicates Very Low Duty Cycle Amplitude Varies over Seconds Set Persistence Long Peaks Consistent Case Study 2 S Band Acquisition Radar ...

Page 40: ...nologies Aerospace Defense Symposium 40 2013 Agilent Technologies Aerospace Defense Symposium S Band Acquisition Radar Spectrum Analyzer View Peak Hold Many Measurements Required Signal Still Not Clear Dynamics Not Shown ...

Page 41: ...echnologies Aerospace Defense Symposium S Band Acquisition Radar Real Time Spectrogram View Long Acquisition Time Long Persistence Excellent for Long Term Signal View seconds Spot a Pattern Spot Big Pulse Set Many Spectra default 10 000 Combined Pulses Still Shown Together ...

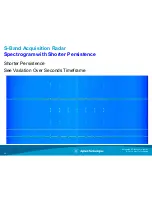
Page 42: ...Technologies Aerospace Defense Symposium 42 2013 Agilent Technologies Aerospace Defense Symposium S Band Acquisition Radar Spectrogram with Shorter Persistence Shorter Persistence See Variation Over Seconds Timeframe ...

Page 43: ...ace Defense Symposium 43 2013 Agilent Technologies Aerospace Defense Symposium S Band Acquisition Radar Spectrogram with Shorter Acquisition Time Shorter Acquisition Time 10 ms vs 30 ms Shorter Persistence See Texture in Vertical Lines ...

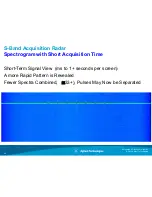
Page 44: ...4 2013 Agilent Technologies Aerospace Defense Symposium S Band Acquisition Radar Spectrogram with Short Acquisition Time Short Term Signal View ms to 1 seconds per screen A more Rapid Pattern is Revealed Fewer Spectra Combined 33 Pulses May Now be Separated ...

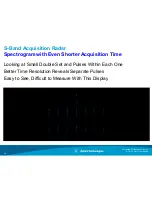
Page 45: ...ent Technologies Aerospace Defense Symposium S Band Acquisition Radar Spectrogram with Even Shorter Acquisition Time Looking at Small Double Set and Pulses Within Each One Better Time Resolution Reveals Separate Pulses Easy to See Difficult to Measure With This Display ...

Page 46: ...nologies Aerospace Defense Symposium Frequency Mask Trigger Radar Signal Spectrum Level Trigger Trigger Acquisition Only on High Peak Can Trigger on Defective Pulses etc Peak Blue vs Combined white Single Display Update Still Made From Many Spectra But Trigger From Single One ...

Page 47: ...lent Technologies Aerospace Defense Symposium Vector Signal Analysis Same Setup Just Press the Red Button Frequency Mask Trigger IF Magnitude Trigger Positive Negative Trigger Delay Capture Without Trigger Spectrogram Shows Timing Adjust Overlap and FFT Length points ...

Page 48: ...nt Technologies Aerospace Defense Symposium Vector Signal Analysis Gap Free Post Processing Reveals an Anomaly Defects Hidden in one Mode or View are Obvious in Another Triggering Not Necessary for Repeating Signal Use Magnitude Trigger To Capture Highest Signal Levels ...

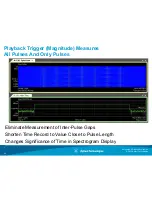
Page 49: ...013 Agilent Technologies Aerospace Defense Symposium Playback Trigger Magnitude Measures All Pulses And Only Pulses Eliminate Measurement of Inter Pulse Gaps Shorten Time Record to Value Close to Pulse Length Changes Significance of Time in Spectrogram Display ...

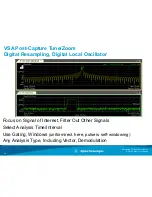
Page 50: ...rospace Defense Symposium VSA Post Capture Tune Zoom Digital Resampling Digital Local Oscillator Focus on Signal of Interest Filter Out Other Signals Select Analysis Time Interval Use Gating Windows uniform rect here pulse is self windowing Any Analysis Type Including Vector Demodulation ...

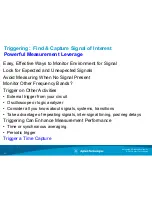
Page 51: ...k for Expected and Unexpected Signals Avoid Measuring When No Signal Present Monitor Other Frequency Bands Trigger on Other Activities External trigger from your circuit Oscilloscope or logic analyzer Consider all you know about signals systems transitions Take advantage of repeating signals inter signal timing pos neg delays Triggering Can Enhance Measurement Performance Time or synchronous avera...

Page 52: ...s Selectable level polarity Selectable holdoff holdoff type Playback IF magnitude trigger Frequency Mask Real time calculation of spectrum test against spectral mask Upper lower limits Build from trace adjust or manual parameter entry Trigger timing ambiguity 1 FFT Logic Enter leave in out enter leave leave enter Negative positive trigger delays Special Triggers IF Mag Frequency Mask ...

Page 53: ...chnologies Aerospace Defense Symposium Reduce Noise Using Playback Trigger Time Avg Trace average power reduces variance only Time average reduces noise Coherent averaging calculates spectrum from averaged time samples ...

Page 54: ...riggering on a Specific Narrow Band Signal in a Crowded RF Environment Agilent PXA Signal Analyzer With VSA Software Agilent EXA Signal Analyzer Queuing Receiver External Trigger Input 1 Trigger Output 1 Configured for Main Trigger Independent Analyzers Allow for Triggering on Separate or Isolated Frequency Bands ...

Page 55: ...m Capture as an Alternative for Triggering Min Untriggered Capture Length for Bursted Signal Ensure a Full Pulse Always Captured Set Capture Length to at Least 2x on time 1x off time Similar to Dig Demod search length For Repeated Signal 2x repeat interval Drag Analysis Region to See Select Interval of Interest ...

Page 56: ...ntercept for Intermittent Signals by Richard Overdorf Agilent PXA Real Time Signal Analyzer Technical Overview literature number 5991 1748EN Vector Signal Analysis Basics literature number 5989 1121EN Webcast Use capture playback triggering to completely analyze a signal http www home agilent com agilent eventDetail jspx cc CA lc eng ckey 1976536 nid 11143 0 00 id 1976536 pselect SR GENERAL ...

Page 57: ... 2013 Agilent Technologies Aerospace Defense Symposium Extras ...

Page 58: ...MAX signal a W CDMA carrier and a bursted GSM signal The lower graphic shows the time domain view of the GSM signal spectrum analyzer in zero span Note The center frequency has been tuned to the GSM signal 910 MHz the bandwidth has been reduced to 1 MHz with the resolution bandwidth control Trigger level has been established at 43 dBm Note trigger output has been configured to Main Trigger ...

Page 59: ...ent Technologies Aerospace Defense Symposium 59 2013 Agilent Technologies Aerospace Defense Symposium Trigger Signal as Generated by EXA Oscilloscope view of the trigger signal output Trigger is clean and stable ...

Reviews: