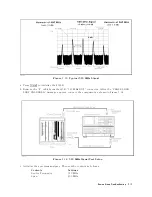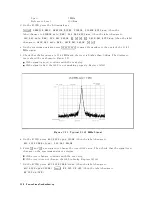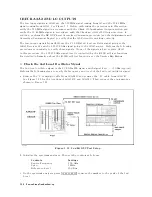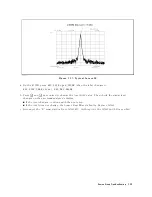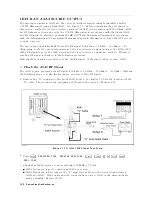
d.
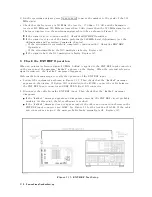
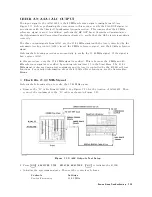
Connect
the
power
sensor
to
the
power
meter
and
calibrate
the
power
meter
for
the
power
sensor
.
Then
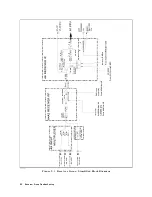
connect
the
equipment
as
shown
in
the
setup
2
of
Figure
7-26.
e.
W
ait
for
the
power
meter
reading
to
settle
.
Then
check
the
power
meter
reading
(RF
signal
level)
is
10
dBm
6
0.5
dB
.
If
the
RF
signal
level
is
good,
continue
with
the
next
step
.
If
the
RF
signal
level
is
bad,
inspect
the
\A"
cable
and
the
connections
between
A3A3
and
A3A1.
F
or
the
location
of
the
\A"
cable
,
see
Figure
7-26.
If
the
cable
and
the
connections
are
good,
A3A3
is
the
most
probable
faulty
assembly
.
Replace
A3A3.
f.
Press
the
following
keys
.
4
Preset
5 ,
4
Sw
eep
5 ,
NNNNNNNNNNNNNNNNNNNNNNNNNNNNNNNNNNNNNNNNNNNNNNN
SWEEP
TYPE
MENU
,
NNNNNNNNNNNNNNNNNNNNNNNNNNNNNNNNNNN
POWER
SWEEP
,
NNNNNNNNNNNNNNNNNNNN
RETURN
,
NNNNNNNNNNNNNNNNNNNNNNNNNNNNNNNNNNNNNNNNNNNNNNNNNN
NUMBER
OF
POINTS
,
4
7
5 ,
4
x1
5 ,
4
Source
5 ,
NNNNNNNNNNNNNNNNNNNNNNN
CW
FREQ
,
4
5
5 ,
4
0
5 ,
4
M/
5 ,
4
Start
5 ,
4
-
5 ,
4
1
5 ,
4
0
5 ,
4
x1
5 ,
4
Stop
5 ,
4
2
5 ,
4
0
5 ,
4
x1
5 ,
4
T
rigger
5 ,
NNNNNNNNNNNNNNNNNNNNNNNNNNNNNNNNNNNNNNNNNNNNNNNNNNNNNNNN
TRIGGER:[FREE
RUN]
,
NNNNNNNNNNNNNNNNNNNN
MANUAL
,
NNNNNNNNNNNNNNNNNNNNNNNNNNNNNNNNNNNNNNNNNNNNNNNNNNNNNNNNNNNNNNNNN
TRIG
EVENT
[ON
SWEEP]
(then
the
label
changes
to
NNNNNNNNNNNNNNNNNNNNNNNNNNNNNNNNNNNNNNNNNNNNNNNNNNNNNNNNNNNNNNNNN
TRIG
EVENT
[ON
POINT]
)
g.
Press
4
T
rigger
5 ,
NNNNNNNNNNNNNNNNNNNN
SINGLE
,
NNNNNNNNNNNNNNNNNNNNNNNNNNNNNNNNNNNNNNNNNNNNNNNNNN
TRIGGER:[MANUAL]
to
start
a
power
sweep
and
to
set
the
4396B
power
to
the
1st
sweep
point
of
010
dBm.
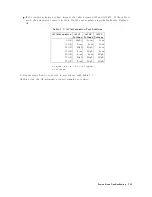
T
able
7-2
lists
test
settings
.
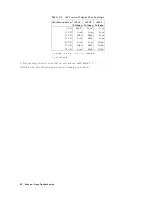
T
able
7-2.
A3A3
Source
T
est
Settings
4396B
Source
P
ower
A3A3
RF
Signal
Level
[a]
P
ower
Sweep
Linearity
1
Limits
010
dBm
a1
=
dBm
a50a1020=
dB
6
0.5
dB
05
dBm
a2
=
dBm
a60a2020=
dB
6
0.5
dB
0
dBm
a3
=
dBm
a70a3020=
dB
6
0.5
dB
+5
dBm
a4
=
dBm
a70a4015=
dB
6
0.5
dB
+10
dBm
a5
=
dBm
a70a5010=
dB
6
0.5
dB
+15
dBm
a6
=
dBm
a70a605=
dB
6
0.5
dB
+20
dBm
a7
=
dBm
1
Calculate
the
linearity
using
the
equations
provided
below
.
h.
W
ait
for
the
power
meter
reading
to
settle
.
Then
record
the
power
meter
reading
in
the
second
column
of
T
able
7-2 .
i.
Press
NNNNNNNNNNNNNNNNNNNN
MANUAL
to
set
the
source
power
to
the
next
measurement
point
listed
in
T
able
7-2 .
Then
repeat
step
h
until
a
power
sweep
is
completed.
The
sweep
indicator
moves
to
the
last
measurement
point
on
the
sweep
.
(The
sweep
indicator
indicates
the
last
measurement
point
on
the
sweep
,
not
the
current
point.)
j.
Calculate
the
power
sweep
linearity
using
the
equations
given
in
T
able
7-2 .
Then
check
that
the
power
sweep
linearity
is
within
the
limits
.
If
the
power
linearity
is
good,
continue
with
the
next
step
.
If
the
power
linearity
is
bad,
inspect
the
\A"
cable
and
the
connections
between
A3A3
and
A3A1.
If
the
cable
and
the
connections
are
good,
A3A3
is
the
most
probable
faulty
assembly
.
Replace
A3A3.
k.
Reconnect
the
\D"
cable
to
A3A3.
At
this
point,
the
A3A3
Source
is
veried.
Source
Group
T
roubleshooting
7-31
Summary of Contents for Agilent 4396B
Page 10: ......
Page 32: ......
Page 43: ...Figure 2 7 CAL OUT Level Adjustment Location Adjustments and Correction Constants 2 11 ...
Page 46: ...Figure 2 10 Comb Generator Output 2 14 Adjustments and Correction Constants ...
Page 62: ...Figure 2 26 Final Gain Adjustment Location 2 30 Adjustments and Correction Constants ...
Page 76: ...Figure 3 1 Troubleshooting Organization 3 2 T roubleshooting ...
Page 84: ......
Page 90: ...Figure 5 1 Power Supply Lines Simpli ed Block Diagram 5 2 Power Supply T roubleshooting ...
Page 107: ...Figure 5 12 Power Supply Block Diagram 1 Power Supply T roubleshooting 5 19 ...
Page 108: ...Figure 5 13 Power Supply Block Diagram 2 5 20 Power Supply T roubleshooting ...
Page 109: ...Figure 5 14 Power Supply Block Diagram 3 Power Supply T roubleshooting 5 21 ...
Page 110: ......
Page 112: ...Figure 6 1 Digital Control Group Simpli ed Block Diagram 6 2 Digital Control T roubleshooting ...
Page 124: ......
Page 126: ...Figure 7 1 Source Group Block Diagram 7 2 Source Group T roubleshooting ...
Page 160: ...Figure 8 1 Receiver Group Simpli ed Block Diagram 8 2 Receiver Group T roubleshooting ...
Page 168: ......
Page 184: ...Figure 10 6 External Test Setup 1 Figure 10 7 External Test Setup 2 10 10 Service Key Menus ...
Page 185: ...Figure 10 8 External Test Setup 3 Figure 10 9 External Test Setup 4 Service Key Menus 10 11 ...
Page 226: ...Figure 11 3 Power Supply Functional Group Simpli ed Block Diagram 11 6 Theory of Operation ...
Page 231: ...Figure 11 5 Digital Control Group Simpli ed Block Diagram Theory of Operation 11 11 ...
Page 235: ...Figure 11 6 Source Simpli ed Block Diagram Theory of Operation 11 15 ...
Page 244: ...Figure 11 7 Receiver Simpli ed Block Diagram 11 24 Theory of Operation ...
Page 249: ...Figure IDC5S11001 here Figure 11 8 4396B Source Group Block Diagram Theory of Operation 11 29 ...
Page 254: ...Figure 12 1 Top View Major Assemblies 12 4 Replaceable Parts ...
Page 290: ...Figure 12 36 Main Frame Assembly Parts 17 19 12 40 Replaceable Parts ...
Page 294: ......
Page 308: ......
Page 311: ...Figure C 1 Power Cable Supplied Power Requirement C 3 ...
Page 312: ......
Page 324: ......

