3-3
Measurements Applications
Measuring Signal-to-Noise Ratios
Measuring Signal-to-Noise Ratios
Signal-to-noise measurements provide a direct indication of system perfor-
mance. Signal-to-noise measurements are especially important in WDM sys-
tems because there is a direct relation between signal-to-noise and bit error
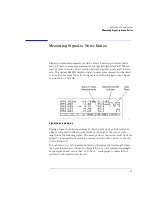
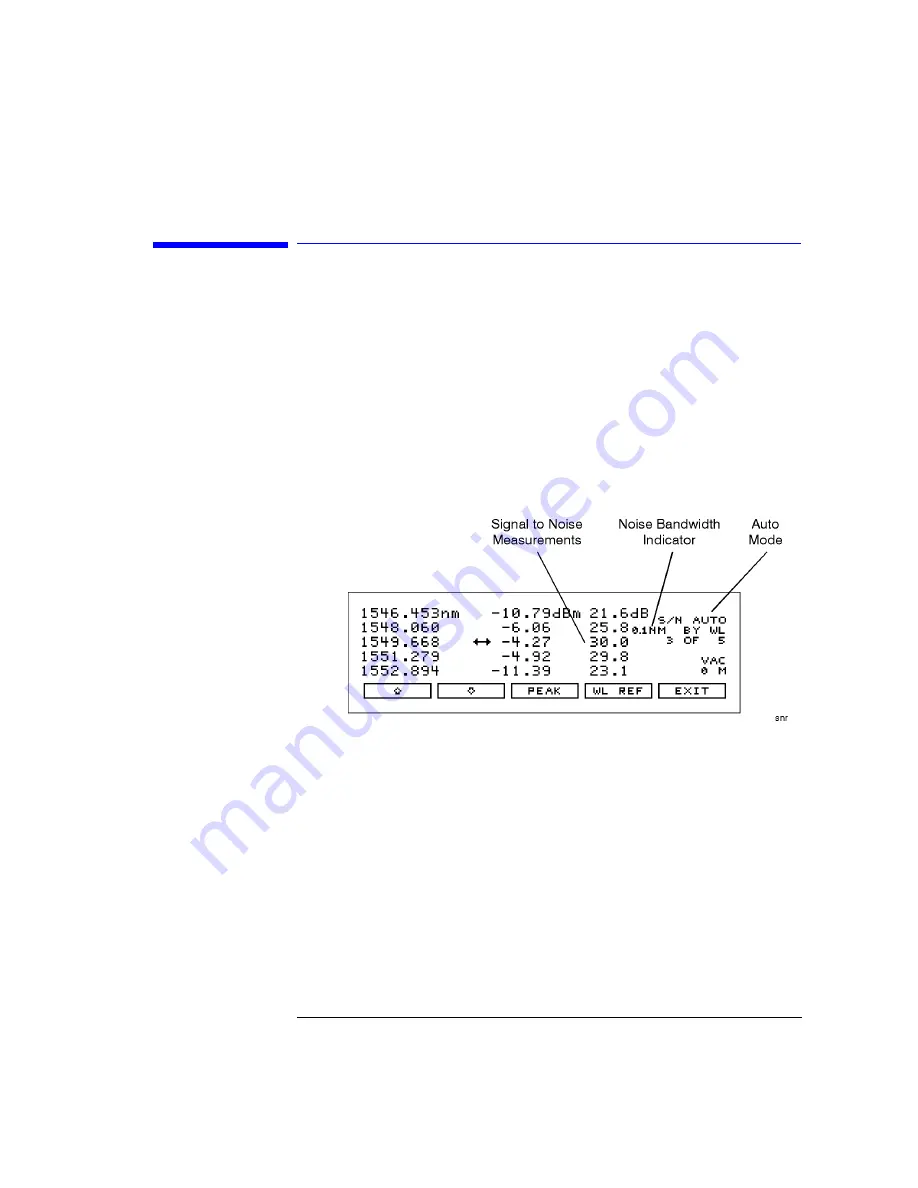
rate. The Agilent 86120B displays signal-to-noise measurements in the third
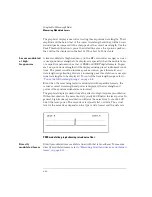
column. For example, the selected signal in the following figure has a signal-
to-noise ratio of 30.0 dB.
Signal-to-noise display.
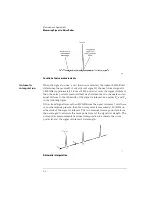
During a signal-to-noise measurement, the absolute power of the carrier, in
dBm, is compared to the absolute power of the noise at the carrier wave-
length. See the following figure. The noise power at the carrier must be deter-
mined by interpolation because the carrier, in most cases, can not or should
not be turned off.
You can select one of two methods used to determine the wavelength where
the noise is measured: automatic interpolation or a user-entered wavelength.
In the figure above, notice that “
S/N AUTO
”
is displayed to indicate that
automatic interpolation is selected.
Summary of Contents for Agilent 86120B
Page 1: ...Agilent 86120B Multi Wavelength Meter User s Guide ...
Page 11: ...Contents 3 Contents Power Cords 8 16 Agilent Technologies Service Offices 8 18 ...
Page 12: ......
Page 38: ......
Page 68: ......
Page 100: ...4 18 Programming Monitoring the Instrument ...
Page 132: ......
Page 230: ......
Page 248: ...8 6 Reference Menu Maps Delta On Menu Delta Off Menu ...
Page 250: ...8 8 Reference Menu Maps System Setup Menu ...
Page 268: ......


