38
Chapter 2
Function Overview
Names and Functions of LCD Display Areas
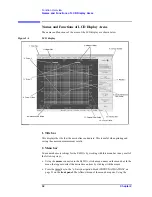
5. Trace 1
This is one of the traces that can be displayed simultaneously on the E4991A. The bar
indicating the trace and scale colors of Trace 1 as well as the measurement parameter
names and their units (in this example, |Z| [
Ω
]) are displayed in the upper-left corner of the
graph. The asterisk (“*”) to the left of the trace number (1 for this trace) indicates that the
trace is the active trace (target trace for setups). One of the traces on the screen must be the
active trace, and any changes to the trace setup are executed for the active trace. The active
trace is changed in sequential order by pressing the
6. Trace 2
This is one of the traces that can be displayed simultaneously on the E4991A. The bar
indicating the trace and scale colors of Trace 2 as well as the measurement parameter
names and their units (in this example,
θ
z
[
°
]) are displayed in the upper-middle area.
7. Markers
These are used to read the values on a trace as numeric values. The value at each marker
position is displayed in the “3. Marker values” on page 34.
8. Scale reference line value
This displays the value of the scale reference line, which is a horizontal dotted line
displayed in the same color as the corresponding trace.
9. Trace 1 axis
This displays the axis and scale of Trace 1.
10. Sweep start value
This displays the current sweep start value.
11. Sweep stop value
This displays the current sweep stop value.
12. Trace 2 axis
This displays the axis and scale of Trace 2.
Summary of Contents for E4991A
Page 6: ......
Page 24: ...18 Contents ...
Page 80: ...74 Chapter3 Setting Measurement Conditions Averaging Measurement Results ...
Page 220: ...214 Chapter9 Setup and Use of Control Management Functions System Recovery ...
Page 338: ...332 AppendixB Probe Station Connection Kit Option 010 OPEN SHORT LOAD Calibration ...
Page 428: ...422 AppendixD Menu References Menu References ...
Page 482: ...476 AppendixI Messages Wait measuring comp standard ...


