508
Chapter 15
Measurement Examples
Measuring the Deviation from a Linear Phase
6. Measure the Deviation from a Linear Phase
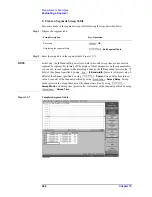
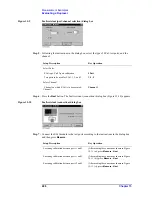
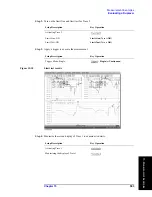
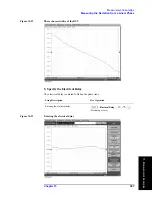
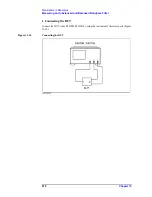
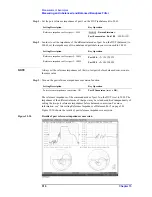
The statistics data is used to read the deviation from a linear phase (peak-to-peak) (Figure
15-24).
Setup Description
Key Operation
Executing the auto scale
-
Auto Scale
Displaying the statistics data
-
Statistics
(Turn it
ON
.)
Figure 15-24
Measuring the deviation from a linear phase
Summary of Contents for E5070B
Page 6: ......
Page 30: ...24 Contents ...
Page 34: ...28 Chapter1 Precautions Before contacting us ...
Page 286: ...280 Chapter6 Data Analysis Using the Equation Editor ...
Page 430: ...424 Chapter12 Optimizing Measurements Performing a Segment by Segment Sweep segment sweep ...
Page 538: ...532 Chapter15 Measurement Examples Executing Power Calibration ...
Page 634: ...628 AppendixB Troubleshooting Warning Message ...
Page 732: ...726 AppendixD Softkey Functions Trigger Menu ...
Page 740: ...734 AppendixE General Principles of Operation Data Processing ...
Page 760: ...754 AppendixF Replacing the 8753ES with the E5070B E5071B Comparing Functions ...

