Chapter 3
81
Setting Measurement Conditions
Selecting a Data Format
3
. Set
ting
M
e
as
ur
em
e
nt
C
onditions
Selecting a Data Format
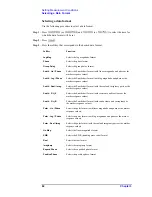
The E5070B/E5071B allows you to display measured S-parameters by using the following
data formats:
R
Rectangular display formats
•
Log magnitude format
•
Phase format
•
Expanded phase format
•
Positive phase format
•
Group delay format
•
Linear magnitude format
•
SWR format
•
Real format
•
Imaginary format
R
Polar format
R
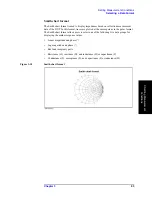
Smith chart format
Rectangular display formats
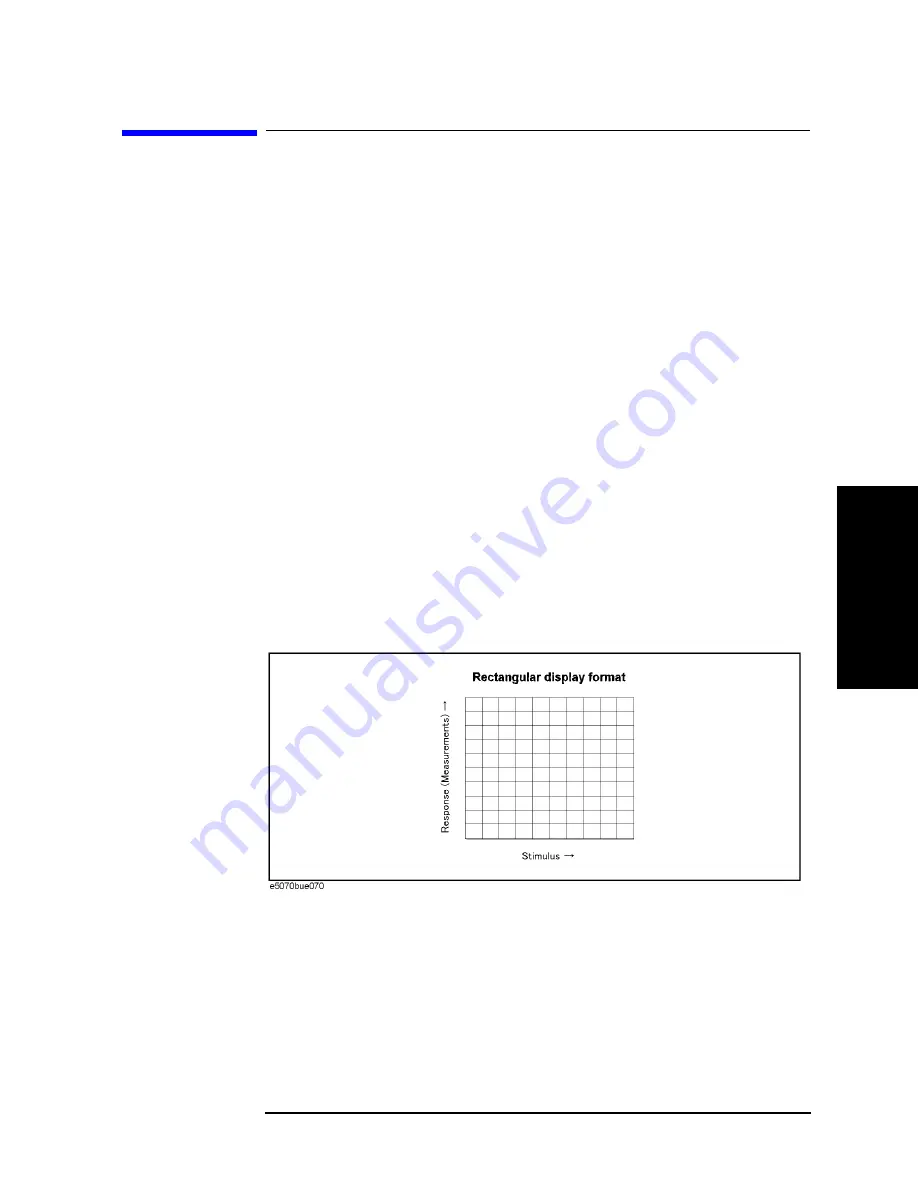
Rectangular display formats draw traces by assigning stimulus values (linear scale) to the
X-axis and response values to the Y-axis (Figure 3-8). Eight different formats are available
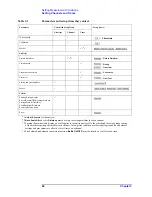
depending on the selection of data for the Y-axis (Table 3-3).
Figure 3-8
Rectangular display format
Summary of Contents for E5070B
Page 6: ......
Page 30: ...24 Contents ...
Page 34: ...28 Chapter1 Precautions Before contacting us ...
Page 286: ...280 Chapter6 Data Analysis Using the Equation Editor ...
Page 430: ...424 Chapter12 Optimizing Measurements Performing a Segment by Segment Sweep segment sweep ...
Page 538: ...532 Chapter15 Measurement Examples Executing Power Calibration ...
Page 634: ...628 AppendixB Troubleshooting Warning Message ...
Page 732: ...726 AppendixD Softkey Functions Trigger Menu ...
Page 740: ...734 AppendixE General Principles of Operation Data Processing ...
Page 760: ...754 AppendixF Replacing the 8753ES with the E5070B E5071B Comparing Functions ...


