2-2
Agilent Technologies E5500 Phase Noise Measurement System
Welcome to the Agilent Technologies E5500 Phase Noise Measurement
System Series of Solutions
Introducing the Graphical User Interface
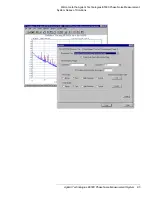
The graphical user interface gives the user instant access to all measurement
functions making it easy to configure a system and define or initiate
measurements. The most frequently used functions are displayed as icons on
a toolbar, allowing quick and easy access to the measurement information.
The forms-based graphical interaction helps you define your measurement
quickly and easily. Each form tab is labeled with its content, preventing you
from getting lost in the define process.
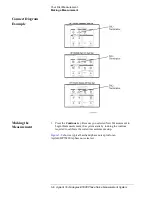
Three default segment tables are provided. To obtain a quick look at your
data, select the “fast” quality level. If more frequency resolution to separate
spurious signals is important, the ‘normal’ and “high resolution” quality
levels are available. If you need to customize the offset range beyond the
defaults provided, tailor the measurement segment tables to meet your needs
and save them as a “custom” selection.
You can place up to nine markers on the data trace, that can be plotted with
the measured data.
Other features include:
•
Plotting data without spurs
•
Tabular listing of spurs
•
Plotting in alternate bandwidths
•
Parameter summary
•
Color printouts to any supported color printer

