5-28
Agilent Technologies E5500 Phase Noise Measurement System
Expanding Your Measurement Experience
Testing the Agilent/HP 8663A Internal/External 10 MHz
Suppression to continue making the noise measurement. The
measurement can be stopped by pressing the Abort key.
Sweep-Segments
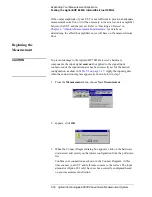
When the system begins measuring noise, it places the noise graph on its
display. As you watch the graph, you will see the system plot its
measurement results in frequency segments.
The system measures the noise level across its frequency offset range by
averaging the noise within smaller frequency segments. This technique
enables the system to optimize measurement speed while providing you with
the measurement resolution needed for most test applications.
When the measurement is complete, refer to
for help in evaluating your measurement results. (If
the test system has problems completing the measurement, it will inform you
by placing a message on the computer display.
Checking the Beatnote
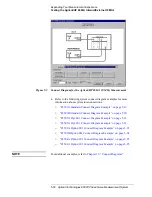
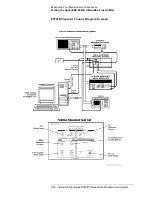
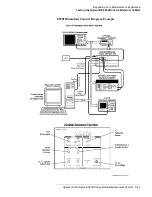
While the Connect Diagram is still displayed, recommend that you use an
oscilloscope (connected to the Monitor port on the Agilent/HP 70420A) or a
counter to check the beatnote being created between the reference source
and your device-under-test. The objective of checking the beatnote is to
ensure that the center frequencies of the two sources are close enough in
frequency to create a beatnote that is within the Capture Range of the
system.
The phase lock loop (PLL) Capture Range is 5% of the peak tuning range of
the VCO source you are using. (The peak tuning range for your VCO can be
estimated by multiplying the VCO tuning constant by the tune range of
VCO. Refer to
Chapter 15, “Evaluating Your Measurement Results”
if you
are not familiar with the relationship between the PLL capture range and the
peak tuning range of the VCO.)
NOTE
If the center frequencies of the sources are not close enough to create a
beatnote within the capture range, the system will not be able to complete its
measurement.
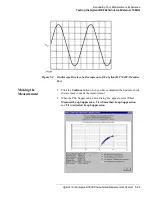
The beatnote frequency is set by the relative frequency difference between
the two sources. If you have two very accurate sources set at the same
frequency, the resulting beatnote will be very close to 0 Hz.
Searching for the beatnote will require that you adjust the center frequency
of one of the sources above and below the frequency of the other source until
the beatnote appears on the oscilloscope’s display.
If incrementing the frequency of one of the sources does not produce a
beatnote, you will need to verify the presence of an output signal from each
source before proceeding.


