Data Analysis Features
185
o
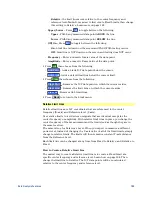
Relative
- the limit line moves relative to the center frequency and
reference level.
Note:
It is easiest to first create Fixed Limits, then change
this setting to Relative. Learn more
on page 185.
o
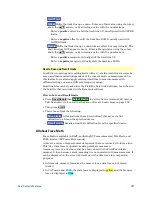
Upper/Lower
– Press
Edit
to toggle between the following:
o
Upper
- FAILS any measured data point
ABOVE
the line.
o
Lower
- FAILS any measured data point
BELOW
the line.
o
Off/On
– Press
Edit
to toggle between the following:
o
On
- Limit line is drawn on the screen and PASS/FAIL testing occurs.
o
Off
- Limit line is NOT drawn on the screen and testing does NOT occur.
o
Frequency
– Enter a numeric X-axis value of the data point.
o
Amplitude
– Enter a numeric Y-axis value of the data point.
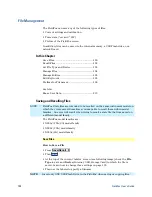
Press
Add
then choose from the following:
o
Add Point
- Adds a blank X/Y data point below the cursor.
o
Add Limit
- Adds a default limit line below the current limit.
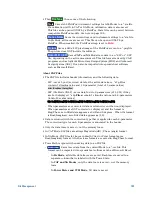
Press
Clear
then choose from the following:
o
Clear Point
- Removes the X/Y data point on which the cursor resides.
o
Clear Limit
- Removes the limit Line on which the cursor resides.
o
Clear All
- Removes ALL limit lines.
Press
<Back
to return to the Limit menu.
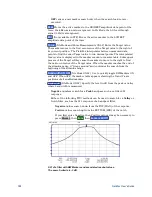
Relative Limit Lines
Relative limit lines are X/Y coordinates that are referenced to the center
frequency (X-axis) and Reference level (Y-axis).
Use relative limits to test devices or signals that are identical except for the
center frequency or amplitude. With relative limit lines in place, you change the
center frequency of the measurement and the limits look as though they are in
the same location.
The same is true for Reference Level. When you expect to measure a different
power level, instead of changing the Y-axis value of all of the fixed limits, simply
change to relative limits. The limits will then remain a constant Y-axis distance
from the Reference Level.
Each limit line can be changed at any time from Fixed to Relative, and Relative to
Fixed.
How to Create a Relative Limit Line
The easiest way to create a Relative limit line is to create a Fixed Limit at a
specific center frequency and reference level. Learn how on page 184. Then
change the limit line to Relative. The X/Y data points will be re-calculated
relative to the center frequency and reference level.


