Displaying Data
6
6000 Series Oscilloscope User’s Guide
257
Using Vectors (Display menu)
One of the most fundamental choices you must make about your
display is whether to draw vectors (connect the dots) between
the samples, or simply let the samples fill in the waveform. To
some degree, this is a matter of personal preference, but it also
depends on the waveform.
•
You will probably operate the oscilloscope most often with
vectors on. Complex analog signals like video and modulated
signals show analog-like intensity information with vectors
on.
•
Turn vectors off when highly complex or multivalued
waveforms are displayed. Turning vectors off may aid the
display of multivalued waveforms such as eye diagrams.
•
Having vectors on does not slow down the display rate.
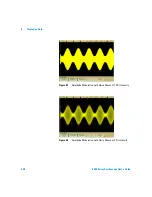
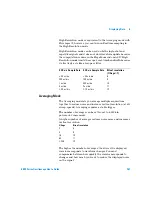
Varying the intensity to view signal detail
The
Intensity
knob lets you adjust the plotted waveforms to
account for various signal characteristics, such as fast sweep
speeds and low trigger rates. Increasing the intensity lets you
see the maximum amount of noise and infrequently occurring
events. Reducing the intensity can expose more detail in
complex signals as shown in the following figures. The intensity
knob does not affect the digital channels.
Summary of Contents for InfiniiVision DSO6014L
Page 2: ...Agilent Technologies Agilent 6000 Series Oscilloscopes User s Guide...
Page 59: ...58 6000 Series Oscilloscope User s Guide 1 Getting Started...
Page 109: ...108 6000 Series Oscilloscope User s Guide 2 Front Panel Controls...
Page 125: ...124 6000 Series Oscilloscope User s Guide 3 Viewing and Measuring Digital Signals...
Page 251: ...250 6000 Series Oscilloscope User s Guide 5 Making Measurements...
Page 287: ...286 6000 Series Oscilloscope User s Guide 6 Displaying Data Interpreting Decoded LIN Data...
Page 321: ...320 6000 Series Oscilloscope User s Guide 7 Saving and Printing Data...
Page 370: ......

