background image

Setting Up the Instrument

9

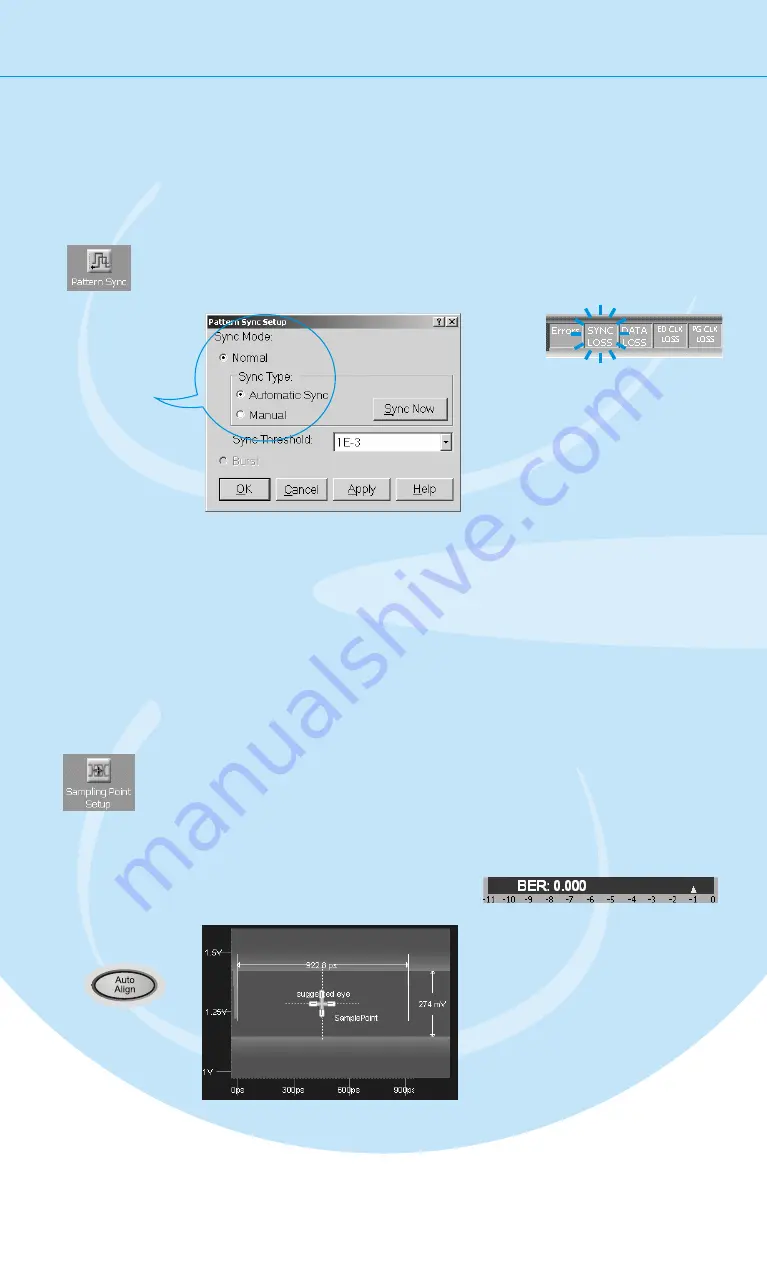
Synchronizing the Pattern

Now make sure that the error detector 
automatically syncs to the data pattern:

With this setting, the error detector starts 
synchronizing when the BER exceeds a 
certain threshold value. You can see when 
it has synchronized when the 

Sync Loss 

indicator goes off. 

Setting the Sampling Point

Now set the optimum sampling point:

Open the 

Pattern Sync 

Setup

 dialog box.

Make sure that 

Normal Sync Mode 

and 

Automatic Sync 

are selected.

1

2

Switch to the 

Sampling Point Setup.

Press the 

Auto Align

 button 

to measure the eye diagram 
and to position the sampling 
point at the center of the eye.
This usually takes 
about 10 seconds.

The BER indicator in the top left 
corner displays the current BER 
at this sampling point which 
should be 0 for this test. 

1

2

If sync fails, the sampling point is 

probably outside of the eye. You should proceed with 

setting the sampling point anyway. As soon as the instrument 

finds the eye, with the settings we just made, it will 

automatically synchronize the patterns.

Summary of Contents for N4906B Serial BERT

Page 1: ...ial BERT check out the Online Help The Help also offers printable versions of the User s Guide and the Programming Guide You only need a few minutes to get started with the Serial BERT This Getting Started Brochure helps you to quickly understand the operating principles and set up your first BER test ...

Page 2: ...tal Conditions Verify that all safety precautions are taken The power cable inlet of the instrument serves as a device to disconnect from the mains in case of hazard The instrument must be positioned so that the operator can easily access the power cable inlet When the instrument is rack mounted the rack must be provided with an easily accessible mains switch Before Applying Power To minimize shoc...

Page 3: ... be terminated with 50 Ohm 1 2 3 The instrument can operate from any single phase AC power source supplying 100 240 V in the frequency range from 47 63 Hz The maximum power consumption is 350 VA with all options installed The power supply automatically adapts to the applied AC power Auto Selection and monitors the AC power range The mains plug can only be inserted in a socket outlet that provides ...

Page 4: ...board purple PS 2 Mouse green Serial Port 1 Parallel Port VGA Monitor Ethernet Port 1 2 Audio Line Output Jack Audio Microphone Input Jack Diagnostic LED Stack USB 2 0 Channel 0 3 The Agilent Serial BERT is available in different versions Depending on your version some of the hardware and functionality described in this brochure may not be available The rear panel of the instrument provides the fo...

Page 5: ...an use the numeric keypad to enter values by hand or the large knob to adjust values You can also use the knobs at the bottom of the instrument to change certain frequently used values in run time Navigating the GUI The menu buttons allow you to quickly navigate through the instrument s four software sections Pattern Setup Pattern Generator Setup Error Detector Setup Results ...

Page 6: ...lt values Now select the logic family LVDS for the data and clock port Check the values to make sure you can t damage your device You can change the output signal parameters according to the needs of your device Let s increase the signal s data offset by 100 mV Just tip the offset field and turn the fine tuning knob until you have the desired value 1 The pattern generator s output ports are always...

Page 7: ...rn to be used for the test Select the Pattern Press the Pattern Setup button to switch to the pattern editor Open the Pattern Select dialog box Select the pattern type 2 n 1 PRBS Select the pattern size 2 31 1 The cable does not convert any data Therefore we use the same pattern for the pattern generator and the error detector Besides generated patterns like PRBS you can also use memory based patt...

Page 8: ...g a cable that is connected to the data input port Set the Input Range so that it covers both the high and low voltage levels of the data signal Enter the termination voltage that matches the output termination of the DUT in our case equal to the pattern generator s data output 1 2 3 4 Switch to the Clock Setup Select External Clock Source as the source for the clock signal 1 2 We have to make sur...

Page 9: ...ke sure that Normal Sync Mode and Automatic Sync are selected 1 2 Switch to the Sampling Point Setup Press the Auto Align button to measure the eye diagram and to position the sampling point at the center of the eye This usually takes about 10 seconds The BER indicator in the top left corner displays the current BER at this sampling point which should be 0 for this test 1 2 If sync fails the sampl...

Page 10: ...the Data In Delay knob to move the sampling point horizontally You can see how the BER increases when measuring at the edge of the eye 1 2 Viewing Eye Results Now let s check the resulting eye Press the Results button to switch to the Results tab Switch to the Eye Results Here you can see the measured eye diagram along with all the important eye parameters If you have done a measurement previously...

Page 11: ... for example be used for testing error correction algorithms Select No Logging because we do not need a measurement log file now Select a Time of 10 seconds as the measurement period 3 4 5 Press the Start Accum button to start accumulating Press the Results button to switch to the Results tab Switch to the Accumulated Results 1 2 Here you can view all statistics measured during the current and the...

Page 12: ...ls Use audio signals that are played for example as warning tones when a specified BER is exceeded How to Get Help The Serial BERT is equipped with a context sensitive Online Help There you will find comprehensive information on the basic concepts of the Serial BERT detailed procedures for operating it and reference information on all elements of the GUI and the programming interface Agilent Corpo...

Reviews: