background image

Functions and Measurements

3

N9320A Spectrum Analyzer

25

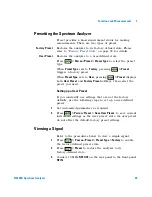
Presetting the Spectrum Analyzer

Preset provides a known instrument status for making 
measurements. There are two types of preset:

Factory Preset

Restores the analyzer to its factory- defined state. Please 
refer to 

“Factory Preset State”

on page 92 for details.

User Preset

Restores the analyzer to a user- defined state.

Press 

 > Pwr on/Preset > Preset Type

 to select the preset 

type.

When 

Preset Type

 sets to 

Factory

, pressing 

 > Preset


triggers a factory preset. 

When 

Preset Type

 sets to 

User

, pressing 

 > Preset

 displays 

both 

User Preset

 and 

Factory Preset 

softkeys, then select the 

preset you need.

Setting up a User Preset

If you constantly use settings that are not the factory 
defaults, use the following steps to set up a user- defined 
preset:

1

Set customized parameters as required.

2

Press


 > Pwr on/Preset


> Save User Preset

, to save current 

instrument settings as the ‘user preset’ state. the user preset 
do not affect the default factory preset settings.

Viewing a Signal

Refer to the procedures below to view a simple signal.

1

Press 

 >


Pow on/Preset > Preset Type > Factory 

to enable 

the factory- defined preset state. 

2

Press 

 > Preset

 to restore the analyzer to its 

factory- defined state.

3

Connect 10 MHz 

REF OUT 

on the rear panel


to the front- panel 

RF IN

.

Preset/

System

Preset/

System

Preset/

System

Preset/

System

Preset/

System

Preset/

System

Summary of Contents for N9320A

Page 1: ...Agilent N9320A Spectrum Analyzer User s Guide...

Page 2: ...n the sep arate agreement shall control Technology Licenses The hardware and or software described in this document are furnished under a license and may be used or copied only in accordance with the...

Page 3: ...Reference Describe every front panel hardkeys and the related softkeys functions in detail 5 One Button Measurements Describe the key definition of one button measurement 6 Instrument Messages This c...

Page 4: ......

Page 5: ...nt and Order List 12 Power Requirements 13 Safety Notice 15 Electrostatic Discharge Protection 16 Environmental Requirements 17 Power on and Check 18 Some helpful Tips 20 Running Internal Alignments 2...

Page 6: ...uation 37 Decreasing the Resolution Bandwidth 39 Trace Averaging 40 Improving Frequency Resolution and Accuracy 41 Tracking Drifting Signals 43 Measuring a Source s Frequency Drift 43 Making Distortio...

Page 7: ...utton Measurements 101 Channel Power 102 Occupied BW 104 ACP 107 Intermod TOI 110 Spectrum Emission Mask 112 6 Instrument Messages 119 Overview 120 Command Errors 121 Execution Conflict 123 Device Spe...

Page 8: ...ile Menu 1 of 2 137 File Menu 2 of 2 138 Frequency Menu 139 Marker Menu 140 Marker Menu 141 Measure Menu 1 of 2 142 Measure Menu 2 of 2 143 MODE Menu 144 Name editor Menu 145 Peak Search Menu 146 Pres...

Page 9: ...Agilent N9320A at a Glance 2 Front Panel Overview 4 Rear Panel Overview 9 Front and rear panel symbols 10 This chapter describes the general features and functions of the Agilent N9320A spectrum analy...

Page 10: ...ass fail limits Upper and lower limits can be set on the screen thereby enable the user to make PASS FAIL judgments on trace data Four trace detection display The spectrum analyzer displays up to four...

Page 11: ...you set functions that affect data on the vertical axis 4 SPAN sets the frequency range symmetrically about the center frequency The frequency span readout describes the total displayed frequency rang...

Page 12: ...detector functions and control what is displayed on the analyzer including the display line as well as the testing of trace data against entered limits MODE selects the measurement mode of your analy...

Page 13: ...functions of the analyzer To switch the analyzer off press the switch for at least 2 seconds This deactivates all the functions but retains power to internal circuits so long as the analyzer is conne...

Page 14: ...date display Preset System Time Date 6 RF attenuation Amplitude Attenuation 7 Marker frequency Marker or Marker Function Frequency Counter 8 Uncal indicator The readout of amplitude is uncalibrated 9...

Page 15: ...Center frequency Frequency Center frequency 20 Continuous peak Peak Search Continuous pk 21 Signal track Frequency Signal Track 22 Internal preamplifier Amplitude Int Preamp 23 Trigger Sweep F free r...

Page 16: ...edge of which triggers the analyzer sweep function BNC female 6 Power switch isolates the analyzer from the AC line power After switch on the analyzer enters into standby mode and the orange standby L...

Page 17: ...at this is an Industrial Scientific and Medical Group 1 Class A product CISPR 11 Clause 4 The instruction manual symbol indicates that the user must refer to spe cific instructions in the manual ISM1...

Page 18: ...10 N9320A Spectrum Analyzer 1 Overview...

Page 19: ...hipment and Order List 12 Power Requirements 13 Safety Notice 15 Electrostatic Discharge Protection 16 Environmental Requirements 17 Power on and Check 18 Some helpful Tips 20 Remote Control 22 This c...

Page 20: ...following items as standard Verify if that the shipment includes your ordered options by checking the option label on the rear panel For any questions about your shipment please Contact Agilent Techn...

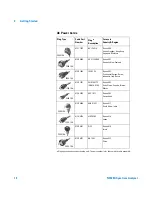
Page 21: ...ded with the analyzer Various AC power cables are available that are unique to specific geographic areas You can order additional AC power cables for use in different areas The table AC Power Cords li...

Page 22: ...ysia 8120 0696 AS 3112 2000 Option 901 Australia New Zealand 8120 1692 IEC 83 C4 Option 902 Continental Europe Korea Indonesia Italy Russia 8120 1521 CNS 10917 2 NEMA 5 15P Option 903 Unite States Can...

Page 23: ...er supply WARNING Personal injury may result if the spectrum analyzer covers are removed There are no operator service parts inside To avoid electrical shock refer servicing to qualified personnel WAR...

Page 24: ...able to the spectrum analyzer connector for the first time each day momentarily short the center and outer conductors of the cable together 2 Personnel should be grounded with a 1 MW resistor isolated...

Page 25: ...n the rear panel and one side of the spectrum analyzer cover Do not allow these holes to be obstructed as they allow air flow through the spectrum analyzer When installing the spectrum analyzer in a c...

Page 26: ...analyzer is in standby mode 3 Press the standby switch on the front panel The Line LED green will light and the spectrum analyzer boots up Self initialization takes about 25 seconds the spectrum analy...

Page 27: ...e are some tips to check the instrument messages 1 Check the display to see if any messages display in the status bar Press More Show Errors to review each messages Please refer to Chapter 6 Instrumen...

Page 28: ...age 93 for details Enable the Options You are required to enter the option license key to enable the option Contact your nearest Agilent Office for purchasing a license Please refer to the procedures...

Page 29: ...erial number available To update the firmware please refer to http www agilent com find n9320 Follow this procedure to finish the firmware update 1 Download the firmware update package to the root dir...

Page 30: ...ection of the spectrum analyzer If you need the remote control more flexible you can also build up your own program by using the SCPI commands For more information about Agilent IO Libraries Suite ref...

Page 31: ...racy 41 Tracking Drifting Signals 43 Making Distortion Measurements 45 Measuring Phase Noise 51 Viewing Catalogs and Saving Files 52 This chapter provides information on the functions and some specifi...

Page 32: ...the active function Knob Increments or decrements the current value Arrow Keys Increments or decrements the current value by step Numeric Keys Enters a specific value Then press the desired terminator...

Page 33: ...ctory Preset softkeys then select the preset you need Setting up a User Preset If you constantly use settings that are not the factory defaults use the following steps to set up a user defined preset...

Page 34: ...t the frequency and amplitude of the marker appear both in the active function block and in the upper right corner of the screen Figure 1 10 MHz Internal Reference Signal Amplitude Frequency SPAN NOTE...

Page 35: ...to move the marker The marker information will display in the upper right corner of the screen Changing Reference Level 1 Press and note that reference level Ref Level is now the active function 2 Pr...

Page 36: ...yzer Press Preset With Preset Type of Factory 2 Connect the rear panel REF OUT to the front panel RF IN 3 Set the analyzer center frequency span and reference level to view the 10 MHz signal and its h...

Page 37: ...ifferences between the markers are displayed in the active function block Figure 2 Delta pair marker with signals on the same screen Peak Search Peak Search NOTE To increase the resolution of the mark...

Page 38: ...Preset the analyzer Press Preset With Preset Type set to Factory 2 Connect the rear panel REF OUT to the front panel RF IN 3 Set the center frequency span and reference level to view only the 50 MHz...

Page 39: ...e 10 MHz reference signal is at a lower frequency than the frequency range currently displayed Figure 3 Delta Marker with Reference Signal Off Screen The delta marker appears on the peak of the 100 MH...

Page 40: ...Press 2 MHz A single signal peak is visible See Figure 5 for example Remote Standby On TG SOURCE CAL OUT 50MHz 10dBm 7 4 1 0 2 5 8 9 6 3 Back Enter Marker Peak Search Marker Auto Tune Det Display Fil...

Page 41: ...hange the resolution bandwidth RBW to 100 kHz so that the RBW setting is less than or equal to the frequency separation of the two signals Press 100 kHz Notice that the peak of the signal has become f...

Page 42: ...dwidth improves the resolution of the individual signals and increase the sweep time Figure 6 Resolving Signals of Equal Amplitude For fastest measurement times use the widest possible resolution band...

Page 43: ...Set the other source to 300 05 MHz at 70 dBm 3 Set the analyzer as follows Press Preset With Preset Type of Factory Press 300 MHz Press 30 kHz Press 500 kHz 4 Set the 300 MHz signal to the reference...

Page 44: ...on the smaller signal Press 1 kHz Press Press Delta Delta On Press 50 kHz Figure 8 Resolved small signal from large signal BW Avg Peak Search Marker NOTE The 1 kHz filter shape factor of 15 1 has a ba...

Page 45: ...taining one signal 3 Set the center frequency span and reference level Press Center Freq 300 MHz Press Span 2 MHz Press Ref Level 40 dBm 4 Move the desired peak to the center of the display CAUTION En...

Page 46: ...enuation to 20 dB Press Attenuation 20 dB Figure 10 A signal closer to the noise level Note that increasing the attenuation moves the noise floor closer to the signal level 7 To view the signal more c...

Page 47: ...the resolution bandwidth Press and The low level signal appears more clearly because the noise level is reduced see Figure 12 Figure 12 Decreasing Resolution Bandwidth A mark appears next to the Res...

Page 48: ...to Sample smoothing the displayed noise level 1 Refer to the first procedure Reducing Input Attenuation of this chapter and follow steps 1 2 and 3 2 Turn average on Press Average On 3 Set the number...

Page 49: ...he analyzer detects the peak of the signal and locate it to the center of the graticule Refer to Auto Tune on page 60 4 Turn the frequency counter on Press Function Freq Counter Freq Counter On 5 Move...

Page 50: ...Change counter resolution Press Function Freq Counter Resolution The frequency counter resolution ranges from 1 Hz to 1 kHz 7 Turn off the marker counter Press Function Freq Counter Freq Counter Off...

Page 51: ...e information please refer to Max Hold on page 100 Use signal tracking to keep a drifting signal in the center of the display The drifting is captured by the analyzer using maximum hold 1 Connect the...

Page 52: ...n indicates the trace mode For example M1 S2 S3 indicates trace 1 is in maximum hold mode trace 2 and trace 3 are in store blank mode 7 Activate trace 2 and change the mode to continuous sweep Press S...

Page 53: ...the input signal Use trace and the RF attenuator to determine which signals if any are internally generated distortion products In this example we use a signal from a signal generator to determine whe...

Page 54: ...analyzer generates harmonic distortion products first display the trace data in trace 2 as follows Press Select Trace Trace 2 Press Clear Write 8 Allow trace 2 to update minimum two sweeps then store...

Page 55: ...ttenuator change the analyzer is generating at least in part the distortion The Marker amplitude readout comes from two sources 1 Increased input attenuation causes poorer signal to noise ratio This c...

Page 56: ...yzer it is useful for determining the TOI performance of the source analyzer combination After the performance of the source analyzer combination has been verified the device under test DUT for exampl...

Page 57: ...distortion products are visible Press and 5 Move the signal to the reference level Press Press Mkr Ref Lvl 6 Reduce the RBW until the distortion products are visible Press and 7 Activate the second ma...

Page 58: ...3 Functions and Measurements 9 Measure the difference between this test signal and the second distortion product see Figure 17 Press Delta Delta On Press Next Peak Figure 17 Measuring the Distortion...

Page 59: ...e fundamental signal 1 Press Preset With Preset Type of Factory 2 Connect a cable from the front panel CAL OUT to RF IN Press Alignment CAL OUT On 3 Press to auto tune the signal to the center of disp...

Page 60: ...has four types of files State stores analyzer settings The extension is STA Trace stores trace information The extension is TRA Screen stores screen captures of the display The extension is JPG Limits...

Page 61: ...and views the files according to a file attribute Local accesses the internal storage to view files USB accesses the external USB storage device to view files 4 The drive space line shows the number...

Page 62: ...e a name based on the type of file you are saving State STATE Trace TRACE Limits LIMIT Screen SCREN It also generates a three digit integer starting at 000 and extending through 999 remembering the pr...

Page 63: ...you need to copy a trace file Press Return Copy Type Trace 4 Using the knob or arrow keys to highlight the file name you need In this example highlight the file TEST1 TRC 5 Press Copy Now to execute...

Page 64: ...56 N9320A Spectrum Analyzer 3 Functions and Measurements...

Page 65: ...s Guide 57 4 Key Reference This chapter describes each front panel hardkey and associated softkeys The front panel keys in this chapter are listed alphabetically The lower level softkeys are arranged...

Page 66: ...control reduces the power level of the analyzer input signal at the input mixer Selecting Auto re couples the attenuator Change the attenuation by using the arrow keys the knob or the numeric keypad K...

Page 67: ...the preamp Amplitude readings then represent the signal value at the input connector When the preamp is on a PA indication appears on the left side of the display The preamp operates over a range of...

Page 68: ...CF 3 Select the appropriate reference level according to the amplitude of searching signal 4 Set span to 1 MHz and all auto couple to view the signal For more information about Peak Search Mkr CF and...

Page 69: ...ference 4 N9320A Spectrum Analyzer 61 Back The backspace key is located on the front panel and is used to change or correct an active function entry or to change a text entry before you save data to a...

Page 70: ...to Res BW on the display when it is not coupled To recouple the resolution bandwidth press Res BW Auto Key access Video BW Auto Man Changes the analyzer post detection filter from 1 Hz to 3 MHz using...

Page 71: ...r will further smooth the trace pressing Avg Type to select the type of averaging To restart averaging Enter a new average number Change any related parameter e g Center Frequency When in sweep single...

Page 72: ...is shown on the left side of the display Selecting an average type manually causes the analyzer to use that type without regard to other analyzer settings and sets Avg Type to Man Key access Video Avg...

Page 73: ...look at all of the data collected during that time and present a single point of trace data based on the detector mode We call the interval during which the data for that trace point is being collecte...

Page 74: ...detector in use is indicated on the left side of the display A will appear next to it if the detector has been manually selected Key access Auto Selects peak detection as the default If a measurement...

Page 75: ...non noise like signals In sample mode the instantaneous signal value of the present display point is placed in memory When Sample detection is selected Samp appears in the upper left corner of the dis...

Page 76: ...Limits Accesses softkeys that allow you to create and define the parameters of limit lines Key access Det Display Limit 1 Limit 2 selects either of the available limits The Limit 1 and Limit 2 keys ac...

Page 77: ...Margin to set a limit line offset for the selected limit line Either Limit or Margin as well as Test must be turned on for a limit test to work Key access Limits Limit 1 2 Edit Accesses the submenu to...

Page 78: ...t point will be connected to the previous point Pressing this key toggles the Connected value of the current point between Yes and No Key access Limits Limit 1 2 Edit Delete Point Deletes the current...

Page 79: ...ter Terminates a front panel keypad numeric entry and enters that value into the analyzer For most applications it is better to use the units softkeys to terminate value entry When in File menu the En...

Page 80: ...Screen Displays all screen JPG files on the selected drive Key access Catalog Type State Displays all state files STA on the selected drive State files contain most instrument settings Key access Cat...

Page 81: ...bar Key access Save Type Selects the type of data for your save Key access Save Screen Displays all previously saved screen files JPG and captures the current screen displayed in preparation to save i...

Page 82: ...es all traces in a single file along with the state When Type is Limits Source accesses the Limit 1 and 2 softkeys Limit 1 and 2 provide data sets to determine whether a trace has exceeded preset spec...

Page 83: ...mits are loaded individually only Key access Load Type Sort Accesses a submenu to view your saved files according to a selected file attribute The selections include By Date By Name and Order Up Down...

Page 84: ...ss Delete Type State Displays state files for deletion Key access Delete Type Trace Displays trace files for deletion Key access Delete Type Limits Displays limits files for deletion Key access Delete...

Page 85: ...r your copy Key access Copy Type Trace Displays all trace files for your copy Key access Copy Type Limits Displays all limits files for your copy Key access Copy Type Sort Sorts the files according to...

Page 86: ...frequency at the right side of the graticule The left and right sides of the graticule correspond to the start and stop frequencies Key access CF Step Auto Man Changes the step size for the center fr...

Page 87: ...ory or All Off turns off the signal track function Setting signal track on and reducing the span initiates an automatic zoom and reduces the span in steps so that the signal remains at the center of t...

Page 88: ...sition of the selected marker The marker number shows above the marker The knob and or arrow keys move the marker left or right Entering a value from the numeric keypad moves the marker to the trace p...

Page 89: ...he start marker number is indicated with a number and an R above the marker for example 1R and the delta marker is indicated with a marker number Key access Delta Span Pair Span Center Toggles the Spa...

Page 90: ...1 kHz Pressing Auto auto couples this resolution to the span Key access Function Freq Count Marker Marker Marker Marker NOTE The ratio of the resolution bandwidth to span must be greater than 0 02 for...

Page 91: ...ompresses the graticule and displays marker information in a table The information includes the marker number trace number marker type X axis value and the amplitude Key access More Optimize Phase Noi...

Page 92: ...access Mkr Start Changes the start frequency so that it is equal to the frequency of the active marker In delta mode Mkr Start sets the start frequency to the marker delta value Mkr Start is not avai...

Page 93: ...ee MODE Meas key displays a menu for measurements such as adjacent channel power occupied bandwidth channel power spectrum emission mask and TOI Refer to Chapter 5 One Button Measurements for more inf...

Page 94: ...nalyzer mode is the default mode and is for general purpose measurement use Additional measurement modes can be added Spectrum Analyzer Selects the spectrum analysis measurement mode for your analyzer...

Page 95: ...Peak Found error message will appear on the display Key access Next Pk Left Moves the marker to the next peak to the left of the current marker The signal peak must exceed the peak threshold value by...

Page 96: ...litude that is not changing Key access More N dB Points On Off Activates the N dB function Pressing N dB Points On activates two arrows that are N dB down from the marker The frequency difference betw...

Page 97: ...above 90 dBm Key access More Search Criteria Threshold Hidden Hides the threshold line Key access More Search Criteria Peak Search Type Selects the peak search mode Key access More Search Criteria Ma...

Page 98: ...Displays a list of up to 12 signal peaks that is updated at the end of each sweep The peak table function works with trace 1 only Key access More Peak Table Peak Sort Freq Amptd Switches the peak tabl...

Page 99: ...trum Analyzer SA mode Brings up the Frequency menu Sets certain conditions to their default values Clears both the input and output buffers and clears all trace data Sets the amplitude values of trace...

Page 100: ...s Pk Off Log scale Division 10 dB Delta Pair Delta Int Preamp Off Span Pair Center Trace 1 Clear Write Trigger Free Run Trace 2 3 4 Blank Markers Normal Off Sweep Time 100 2 ms Auto Marker Delta Off S...

Page 101: ...pe Selects User or Factory preset settings Key access Pwr on Preset User Pressing Preset recalls the analyzer settings defined by Save User Preset Key access Pwr on Preset Preset Type Factory Pressing...

Page 102: ...how Hardware Provides detailed information about the hardware installed on your analyzer including the model number and firmware revision Key access More Show Software Provides detailed information ab...

Page 103: ...ueue Clears all the errors in the errors queue Key access More Show Errors Preset System Preset System Preset System Time Date On Off Toggles the time date display between on and off Key access More T...

Page 104: ...icense Key Allows you to key in a license key number The license key number appears on the second line of the License Key softkey Key access More More Licensing Activate License Activates the option w...

Page 105: ...to linear divide the frequency span by 10 Span Enters a span frequency range value Key access Full Span Changes the span to full span showing the full frequency range of the analyzer Full span sets Si...

Page 106: ...n process is influenced by several factors The maximum tuning rate of the spectrum analyzer The selected resolution and video bandwidth filters The maximum sample rate of the analog to digital convert...

Page 107: ...n the input signal exceeds the trigger level at the left edge of the display Change the trigger level by using the arrow keys the knob or the numeric keypad Key access More External Pos Activates the...

Page 108: ...and updates each trace point if a new maximum level is detected in successive sweeps Key access Min Hold Retains the minimum level for each trace point of the selected trace and updates each minimum...

Page 109: ...Emission Mask 112 This chapter provides you with functional descriptions of all available measurements when you press the front panel hardkey Spectrum Analyer is selected We assume that you understan...

Page 110: ...el bandwidth The power calculation method used to determine the channel power is a traditional method known as the integration bandwidth IBW method A swept spectrum is used as the basis for this calcu...

Page 111: ...h the existing average Exponential averaging weights new data more than old data which facilitates tracking of slow changing signals The average will be displayed at the end of each sweep If you selec...

Page 112: ...9 occupied power bandwidth Markers are placed at the frequencies on either side of 99 of the power 1 of the power is evenly distributed outside the markers The difference between the marker frequencie...

Page 113: ...ch successive data acquisition after the average count is reached is exponentially weighted and combined with the existing average Exponential averaging weights new data more than old data which facil...

Page 114: ...dB Bandwidth result is also called the emissions bandwidth or EBW This will set two arrows to your specified dB value below the maximum power and compute the total power between the arrows Frequencies...

Page 115: ...hat will be averaged when calculating the measurement result The average will be displayed at the end of each sweep Pressing Off disables the measurement averaging Key access ACP Avg Mode Exp Repeat E...

Page 116: ...cess ACP Meas Meas Offset A B C D E F Selects the offset the softkeys will affect Press Offset until the letter of the desired offset is underlined Key access ACP Offset Limits Offset Freq On Off Sets...

Page 117: ...y be entered by the user Relative values are displayed referenced to the total power measured in the main channel when Meas Type is set to PSD Ref pressing this key sets the power spectral density in...

Page 118: ...yed at the end of each sweep Setting Avg Number to Off disables measurement averaging Key access More Intermod TOI Avg Mode Exp Repeat Selects the type of termination control used for the averaging fu...

Page 119: ...running Key access More Intermod TOI Max Mixer Lvl Auto Man Sets the relationship between the highest signal that can be displayed the reference level and the input attenuation The relationship applie...

Page 120: ...y band For WLAN the reference power is taken as the peak PSD in the signal and all offset results are also the peak PSD in that offset as opposed to the integrated power Figure 25 Spectrum Emission Ma...

Page 121: ...r spectral density values for the offsets Key access More Spectrum Emission Mask Meas Type Meas Meas Chan Integ BW Specifies the integration bandwidth used in calculating the power in the main channel...

Page 122: ...is selected this is the measured power in the reference carrier PSD Ref is the mean power spectral density in the carrier that is used as the reference in computing the relative power spectral densit...

Page 123: ...84 Man 35 50 39 00 1 C On 7 500 8 500 1000 00 55 84 55 84 Man 39 00 49 00 1 D On 8 500 12 000 1000 00 55 84 55 84 Couple 49 00 49 00 1 E Off 12 500 15 000 1000 00 55 84 55 84 Couple 49 00 49 00 1 Tabl...

Page 124: ...s BW Meas BW Abs Start Abs Stop and so forth Press Offset until the letter of the desired offset is underlined Only one selection at a time is shown on this key label Key access More Spectrum Emission...

Page 125: ...flat limit line If set to Man Abs Start and Abs Stop you can enter different values to make a sloped limit line Key access More Spectrum Emission Mask Offset Limits More Rel Start Enters a relative le...

Page 126: ...ing limit for Abs Start and Abs Stop and the limit for Rel Start and Rel Stop Key access More Spectrum Emission Mask Offset Limits More More Fail Mask Abs OR Rel Set the limit test to show Fail if one...

Page 127: ...s Agilent N9320A Spectrum Analyzer User s Guide 119 6 Instrument Messages Overview 120 Command Errors 121 Execution Conflict 123 Device Specific Errors 125...

Page 128: ...spectrum analyzer corrected the setting automatically You need to press More Show errors to read the specific descriptions of those messages Example In this example an explanation is generally includ...

Page 129: ...parator The parser was expecting a separator and encountered an illegal character 104 Data type error The parser recognized a data element that is not allowed 108 Parameter not allowed More parameters...

Page 130: ...ing a suffix This message is used when the device cannot detect more specifics described for errors 131 to 139 131 Invalid suffix The suffix does not follow the syntax described in IEEE 488 2 or the s...

Page 131: ...oints entered Indicates that a legal program data element of block expression or string type was received that contained more data than the device could handle due to memory or related device specific...

Page 132: ...Analyzer 6 Instrument Messages 330 Self test failed A self test failure occurred Report this error to Agilent Technologies 340 calibration failed An expected file was not found while trying to load i...

Page 133: ...port this error to the nearest Agilent Technologies sales or service office 201 Option not installed The desired operation cannot be performed because a required option is not installed 204 TG Frequen...

Page 134: ...attenuation or decrease the input signal level 502 IF over load Either increase input attenuation or decrease the input signal level 604 File already exists You attempted to save to a file that alread...

Page 135: ...nalyzer 752 Unable to load state from file Attempt to load a state from a file failed 753 Unable to save state to file Attempt to save a state to a file failed See the associated error messages for th...

Page 136: ...sent a remote command to save a screen file but did not specify a valid extension 780 No Peak Found No signal peak was found that meets the criteria under Search Criteria 781 Video Trigger cannot be a...

Page 137: ...129 7 In Case of Difficulty Check the Basics 130 Read the Warranty 131 Contact Agilent Technologies 132 This chapter includes information on how to check for a problem with your spectrum analyzer and...

Page 138: ...settings are correct If the analyzer is not functioning as expected return the analyzer to a known state by pressing Preset For details refer to Presetting the Spectrum Analyzer on page 25 Is the meas...

Page 139: ...terms If your spectrum analyzer is covered by a separate maintenance agreement please be familiar with its terms Agilent Technologies offers several optional maintenance plans to service your spectrum...

Page 140: ...um analyzer by its product number and full serial number press More Show System Online help http www agilent com find assist United State tel 800 829 4444 fax 800 829 4433 Canada tel 877 894 4414 fax...

Page 141: ...n of the front panel keys and their associated menu keys in Spectrum Analyzer mode Refer to Chapter 4 Key Reference for key function descriptions The name editor menu is shown separately though it is...

Page 142: ...0A Spectrum Analyzer 8 Menu Maps Amplitude Menu Attenuation Auto Man More 1 of 2 Scale Div Scale Type Log Lin Int Preamp On Off Y Axis Units More 2 of 2 dBm dBmV Amps dBuV dBuA Watts Volts Amplitude R...

Page 143: ...Menu Maps 8 N9320A Spectrum Analyzer 135 BW Avg Menu Res BW Auto Man Video BW Auto Man VBW RBW Auto Man Average On Off Avg Type Auto Man Auto Video Avg Pwr Avg BW Avg...

Page 144: ...n Display Line On Off Auto Positive Peak Negative Peak Average Video RMS Sample Normal Limit 1 Limit 2 Return Delete All Limits Type Upper Lower Limit On Off Return Test On Off Margin On Off Edit Dele...

Page 145: ...atalog Save Load Delete Copy By Date By Name Return Order Up Down All Screen State Trace Limits Type Return Sort Local USB File Type Return Name Save Now Source Screen State Trace Limits Type Return N...

Page 146: ...Type selection Catalog Save Load Delete Copy Trace 1 Trace 2 Trace 3 Trace 4 State Trace Limits File Type Return Sort Copy Now Type Return Sort Load Now Destination By Date By Name Return Order Up Do...

Page 147: ...Menu Maps 8 N9320A Spectrum Analyzer 139 Frequency Menu Center Freq Start Freq Stop Freq CF Step Auto Man Signal Track On Off Frequency...

Page 148: ...ir Ref Delta Return Span Pair Span Center Marker Phase Noise Opti F Noise On Off Select Marker 1 Marker Trace Auto 1 2 3 4 More 2 of 2 Marker Table Phase Noise On Off Offset Manual Offset 1KHz 1kHz Of...

Page 149: ...Menu Maps 8 N9320A Spectrum Analyzer 141 Marker Menu Mkr CF Mkr CF Step Mkr Start Mkr Stop Mkr Ref Lvl Marker...

Page 150: ...an Pwr Span Avg Number On Off Avg Mode Exp Repeat Return Max Hold On Off Occ BW Pwr OBW Span More X dB Return More Avg Number On Off Avg Mode Exp Repeat Return Chan Integ BW Offset Limits Meas Type To...

Page 151: ...r Lvl Auto Man Avg Number On Off Meas Type Return Ref Channel Offset Limits Chan Integ BW Chan Span Return Sweep Time Auto Man Res BW Auto Man Total Pwr PSD Ref Total Pwr Ref PSD Ref Offset ABCDEF Sta...

Page 152: ...144 N9320A Spectrum Analyzer 8 Menu Maps MODE Menu Spectrum Analyzer Tracking Generator MODE...

Page 153: ...Menu Maps 8 N9320A Spectrum Analyzer 145 Name editor Menu ABCDEFG HIJKLMN Return OPQRSTU VWXYZ Name...

Page 154: ...2 Next Pk Right Next Pk Left Pk Pk Search Peak Excursion Peak Threshold Return Threshold Hidden Peak Search Type Peak Table On Off Peak Sort Freq Amptd Return Continuous Pk On Off N dB Points On Off M...

Page 155: ...sh Show System More 2 of 3 Show Errors User Factory Alignment Return Timebase Load defaults Power On Last Preset Preset Type Return Save User Preset Preset System Show Hardware Show Software Time Date...

Page 156: ...148 N9320A Spectrum Analyzer 8 Menu Maps SPAN Menu Span Full Span Zero Span Last Span SPAN...

Page 157: ...Menu Maps 8 N9320A Spectrum Analyzer 149 Sweep Trig Menu Sweep Time Auto Man Sweep Single More 1 of 2 Sweep Cont Free Run Video More 2 of 2 External Pos External Neg Sweep Trig...

Page 158: ...150 N9320A Spectrum Analyzer 8 Menu Maps View Trace Menu Select Trace 1 Clear Write Max Hold Min Hold View Blank Trace 1 Trace 2 Trace 3 Trace 4 View Trace...

Page 159: ...T 5 EXT TRG IN 8 PROBE POWER 5 REF IN 8 REF OUT 8 RF IN 5 TG SOURCE 5 USB 5 8 VGA 8 Continuous PK 88 Copy 76 CSA mark 9 c tick mark 9 D Data control keys 4 Delete 75 delta marker 80 Det Display key 4...

Page 160: ...ents 13 power switch 8 Preset 91 preset factory 25 user 25 Preset System key 4 91 PROBE POWER 5 Pwr on Preset 93 R rear panel overview 8 REF IN 8 Ref level 58 REF OUT 8 Rel Start 117 Rel Stop 117 remo...

Page 161: ...SPR 11 1990 EN 55011 1991 IEC 61000 4 2 1995 A1 1998 EN 61000 4 2 1995 IEC 61000 4 3 1995 EN 61000 4 3 1995 IEC 61000 4 4 1995 EN 61000 4 4 1995 IEC 61000 4 5 1995 EN 61000 4 5 1995 IEC 61000 4 6 1996...

Reviews: