Frequency and Time Domain Analysis
6
U8903A User’s Guide
115
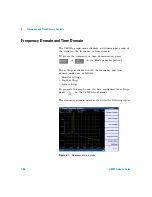
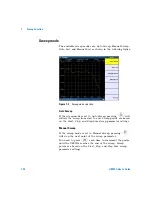
Figure 6-9
Marker measurement data display
Marker –>
This function allows you to view a section of the graph
based on the selected current marker position. Using the
softkeys, you may configure the graph area to be displayed
by positioning the current marker at either the center, start,
or stop point of the graph plot. In addition, you can also
view the area between the current marker and reference
marker by pressing
Marker
Span
. To access the
Marker
menu, press
on the Graph panel.
Summary of Contents for u8903a
Page 1: ...Agilent Technologies Agilent U8903A Audio Analyzer User s Guide...
Page 12: ...XII U8903A User s Guide...
Page 20: ...XX U8903A User s Guide...
Page 22: ...XXII U8903A User s Guide...
Page 38: ...16 U8903A User s Guide 1 Getting Started...
Page 74: ...52 U8903A User s Guide 2 Operation and Features...
Page 90: ...68 U8903A User s Guide 3 Instrument Configuration...

