background image

U8903A User’s Guide

III

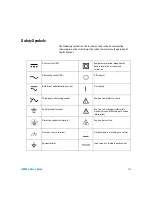
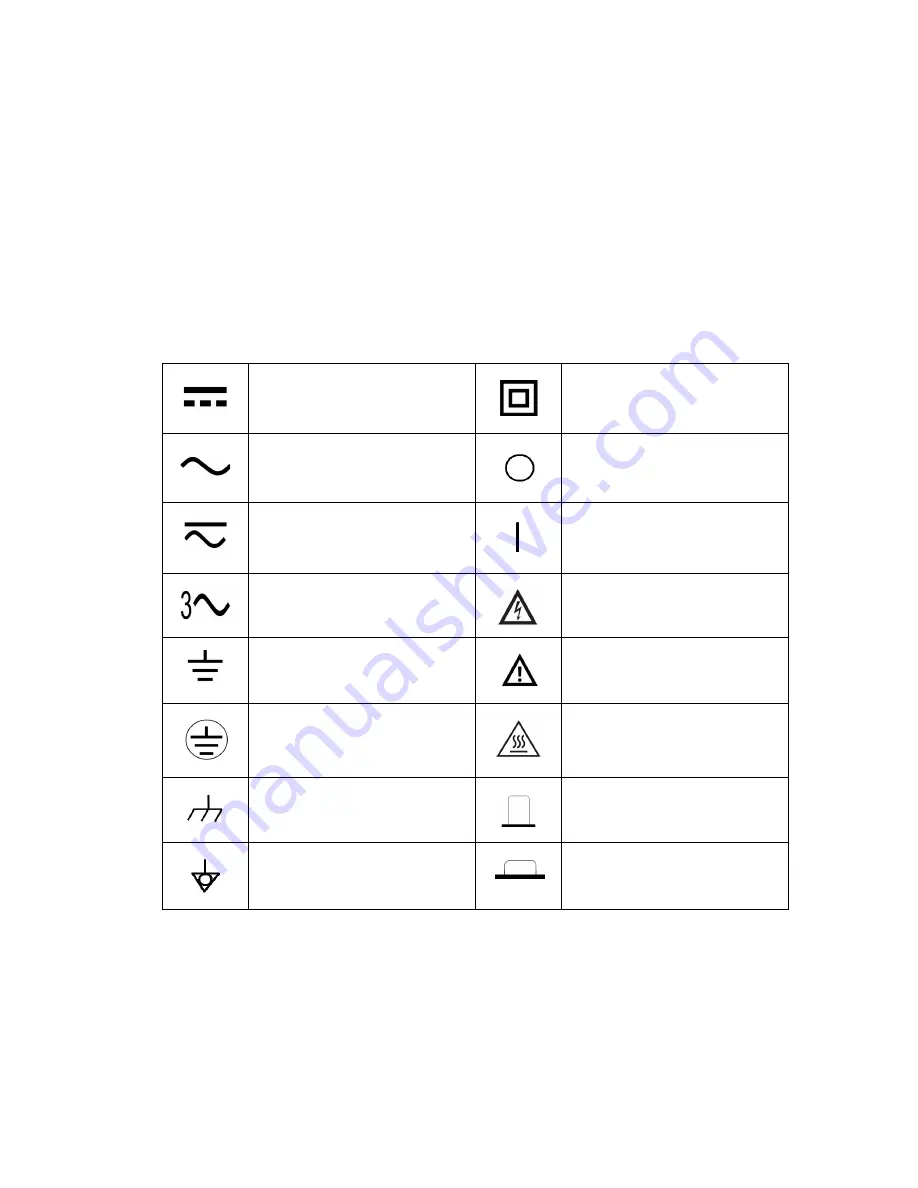
Safety Symbols

The following symbols on the instrument and in the documentation 
indicate precautions which must be taken to maintain safe operation of 
the instrument.

Direct current (DC)

Equipment protected throughout by
double insulation or reinforced
insulation

Alternating current (AC)

Off (supply)

Both direct and alternating current

On (supply)

Three-phase alternating current

Caution, risk of electric shock

Earth (ground) terminal

Caution, risk of danger (refer to this 
manual for specific Warning or Caution 
information)

Protective conductor terminal

Caution, hot surface

Frame or chassis terminal

Out position of a bi-stable push control

Equipotentiality

In position of a bi-stable push control

Summary of Contents for u8903a

Page 1: ...Agilent Technologies Agilent U8903A Audio Analyzer User s Guide...

Page 2: ...nt that conflict with these terms the warranty terms in the sep arate agreement shall control Technology Licenses The hardware and or software described in this document are furnished under a license...

Page 3: ...ion or reinforced insulation Alternating current AC Off supply Both direct and alternating current On supply Three phase alternating current Caution risk of electric shock Earth ground terminal Cautio...

Page 4: ...cuits Operating personnel must not remove equipment covers or shields Procedures involving the removal of covers or shields are for use by service trained personnel only Under certain conditions dange...

Page 5: ...r service that is not covered in this manual should only be performed by qualified personnels Observe all markings on the device before establishing any connection Always use dry cloth to clean the de...

Page 6: ...ng temperature 0 C to 55 C Operating humidity 30 to 80 RH noncondensing at 40 C Storage temperature 40 C to 70 C Storage humidity 30 to 80 RH noncondensing at 65 C CAUTION The U8903A audio analyzer co...

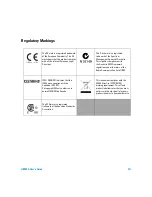
Page 7: ...h the Australia EMC Framework regulations under the terms of the Radio Communication Act of 1992 ICES NMB 001 indicates that this ISM device complies with the Canadian ICES 001 Cet appareil ISM est co...

Page 8: ...trical electronic product in domestic household waste Product Category With reference to the equipment types in the WEEE directive Annex 1 this instrument is classified as a Monitoring and Control Ins...

Page 9: ...ou through the configuration of the U8903A input and output settings for optimum measurement results 4 Audio Generator Functions This chapter provides you the information on the audio generator functi...

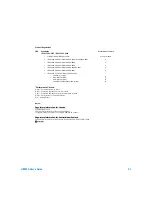
Page 10: ...8 kV AD IEC 61000 4 3 2002 EN 61000 4 3 2002 3 V m 80 MHz 1 0 GHz 3 V m 1 4 GHz 2 0 GHz 1 V m 2 0 GHz 2 7 GHz IEC 61000 4 4 2004 EN 61000 4 4 2004 1 kV signal lines 2 kV power lines IEC 61000 4 5 200...

Page 11: ...4 o 100 Dip 1 cycle A o 60 Dip 10 cycles A o 30 Dip 25 cycles B o 100 Short Interruptions 250 cycles B 1 Performance Criteria A Pass Normal operation no effect B Pass Temporary degradation self recove...

Page 12: ...XII U8903A User s Guide...

Page 13: ...ies 10 Optional Accessories 10 Installation and Configuration 11 Initial inspection 11 Ventilation 11 Rack mounting 11 Maintenance 12 Fuse removal replacement 12 Power On the U8903A 13 Preset 14 Help...

Page 14: ...6 AC DC coupling 57 AC level detection 58 Digital filters 59 Input configuration 60 Input ranging 61 Common Settings 62 Measurement bandwidth 62 Measurement time 63 Trigger 65 Output Settings 66 Outpu...

Page 15: ...6 SNR and Noise Level 97 SMPTE intermodulation distortion SMPTE IMD 99 Difference frequency distortion DFD 100 Phase 101 Crosstalk channel driven and channel measured 103 6 Frequency and Time Domain A...

Page 16: ...analyzer 130 131 Graph mode 132 Audio filters 132 Sweep capability 133 Measurement Category 135 Measurement category definitions 135 Index 137 Appendixes 139 Appendix A SMPTE IMD and DFD Default Sett...

Page 17: ...e 2 8 Frequency and time domain menu trees 36 Figure 2 9 Sweep function menu tree 38 Figure 2 10 Graph panel 39 Figure 2 11 Run Stop or On Off option 40 Figure 2 12 Channel selection and status 41 Fig...

Page 18: ...rm parameters 76 Figure 4 9 SMPTE IMD waveform menu 77 Figure 4 10 DFD IEC 60118 waveform menu 78 Figure 4 11 DFD IEC 60268 waveform menu 79 Figure 4 12 Noise signal selection 80 Figure 4 13 Gaussian...

Page 19: ...re 6 1 Frequency domain mode 106 Figure 6 2 Time domain mode 107 Figure 6 3 Monitor settings page 108 Figure 6 4 Input settings page 111 Figure 6 5 Axis settings page 112 Figure 6 6 Harmonics display...

Page 20: ...XX U8903A User s Guide...

Page 21: ...scription 23 Table 2 2 Generator menu description 27 Table 2 3 Analyzer menu description 33 Table 2 4 Graph frequency time domain menu description 37 Table 2 5 Sweep menu description 38 Table 2 6 Grap...

Page 22: ...XXII U8903A User s Guide...

Page 23: ...uct outlook 5 Product Dimensions 9 Standard Accessories 10 Optional Accessories 10 Installation and Configuration 11 Initial inspection 11 Ventilation 11 Rack mounting 11 Maintenance 12 Fuse removal r...

Page 24: ...he U8903A is equipped with frequency and time domain graph functions as well as sweep capability for frequency amplitude and phase The U8903A audio generator has a frequency range of 5 Hz to 80 kHz It...

Page 25: ...measurement THD N Ratio measurement THD N Level measurement SINAD measurement Signal to noise ratio SNR measurement Noise Level measurement SMPTE IMD measurement DFD measurement Crosstalk measurement...

Page 26: ...ped using LXI Technology LXI an acronym for LAN eXtension for Instrumentation is an instrument standard for devices that use the Ethernet LAN as their primary communication interface Hence it is easy...

Page 27: ...1 U8903A front panel Table 1 1 U8903A front panel description 2 1 3 11 13 14 4 5 6 7 8 9 10 12 Item Display Description 1 LCD display Provides information on the current function including status indi...

Page 28: ...or output for all active channels 6 Graph Enables access to the graph functions including peak navigation and marker function You can also use the Full Screen function to maximize the display area 7 M...

Page 29: ...for each channel 12 Analyzer input Accepts an audio signal from the UUT A XLR female input connector and a BNC female input connector are provided for each channel 13 USB host Used to connect a USB ex...

Page 30: ...pose Interface Bus IEEE 488 standard interface 5 USB host Used to connect a USB external flash storage 6 USB device Allows communication with the PC via a USB cable 7 LAN interface Allows Ethernet LAN...

Page 31: ...Getting Started 1 U8903A User s Guide 9 Product Dimensions Top view Front view 405 00 mm 426 80 mm 141 35 mm...

Page 32: ...N cable USB cable USB flash storage device Agilent U8903A Audio Analyzer Quick Start Guide Agilent U8903A Audio Analyzer Product Reference CD ROM Certificate of Calibration Optional Accessories The fo...

Page 33: ...the temperature range of 0 C to 55 C The U8903A is cooled by drawing air through the sides and rear and exhausting it through the ventilation holes on the top sides and rear The U8903A must be instal...

Page 34: ...ble to see two fuses The active fuse is the one on the right while the other is the backup 3 Remove the active fuse and replace it with the one of the correct rating and type for your selected input A...

Page 35: ...st to the correct line voltage in the range of 100 Vac to 240 Vac To turn on the U8903A press located on the lower left corner of the front panel Press again to turn off the U8903A WARNING Always use...

Page 36: ...either one of the following steps Send the RST SYSTem PRESet SYSTem RESet MODE or SYSTem RESet CHANnel SCPI commands from the PC via the USB GPIB or LAN interface Press on the System panel Opt 906 Swi...

Page 37: ...uire The key displays the description of all the front panel keys and current softkeys To activate the help mode press To deactivate press When Help is enabled the function keys will not execute their...

Page 38: ...16 U8903A User s Guide 1 Getting Started...

Page 39: ...eep function 20 Frequency domain analysis 20 Digital filters 21 Front Panel Operation 22 Mode 22 Graph functions 39 Run Stop and On Off 40 System 42 Front Panel LCD Display 49 Editing Keys 50 This cha...

Page 40: ...U8903A performs the following two basic functions Audio signal generation Audio signal analysis The U8903A basic configuration has two channels of generator functions and two channels of analyzer fun...

Page 41: ...low is the list of the audio analyzer features Balanced input signals XLR Unbalanced input signals BNC Frequency measurement AC voltage measurement DC voltage measurement Phase measurement THD N Ratio...

Page 42: ...perform sweeps and the results are displayed on the LCD display The sweep function offers you flexible sweep configurations to cater to the various waveform types and parameters The available main set...

Page 43: ...C Message and A Weighting The U8903A also allows user defined filters to be uploaded to the device You need to specify the filter parameters comprising filter type group delay and coefficients sectio...

Page 44: ...ont Panel Operation The front panel keys are organized in groups based on their functions as follows Mode Graph System Softkeys Controls Data Entry Navigation keys Knob Mode This group provides quick...

Page 45: ...nu tree shows the waveform functions consisting of Sine Variable Phase and Dual Sine while the second section shows the other waveform functions comprising Noise DC Multitone Square and Arbitrary The...

Page 46: ...le Phase Waveform Frequency Output Settings Phase 1 Dual Sine Dual Waveform Frequency 1 Amplitude Frequency 2 DC Offset Amplitude DC Offset Ratio Output Settings SMPTE IMD 1 1 SMPTE IMD 4 1 SMPTE IMD...

Page 47: ...DC Multitone Square and Arbitrary menu tree Generator Noise Gaussian DC Multitone Waveform Start Freq Tones Amplitude DC Offset Multiplier Output Settings Waveform Rectangular Waveform Amplitude Outpu...

Page 48: ...ws Figure 2 4 Generator Output Settings Frequency Amplitude and DC Offset menu tree Generator Output Type Amplitude Balanced Unbalanced Common Frequency DC Offset Output Settings Impedance 50 600 100...

Page 49: ...ted channel with reference to channel 1 Dual Sine Dual Waveform Select the signal waveform type Output Settings Refer to Output Settings Frequency 1 Enter the first sinewave component frequency value...

Page 50: ...Amplitude Enter the composite signal amplitude value DC Offset Enter the signal DC offset value Noise Gaussian Rectangular Waveform Select the signal waveform type Output Settings Refer to Output Sett...

Page 51: ...signal DC offset value Recall File Imports an arbitrary waveform from a file Save File Saves the existing arbitrary waveform to a file Preview Displays a preview of the arbitrary waveform in the time...

Page 52: ...k Ch Driv X talk Ch Meas SMPTE IMD DFD 60268 2nd DFD 60268 3rd DFD 60118 2nd Units Function 1 Function 2 Refer to the Units menu tree Analyzer Settings Coupling Detector Filter Input Type Range AC DC...

Page 53: ...ion menu tree for Units is shown as follows Figure 2 6 Analyzer Units menu tree Analyzer Hz V Units Function 1 Function 2 If function type is Frequency dBu dBV dBm W dBr dBg If function type is Amplit...

Page 54: ...ure 2 7 Analyzer Ref Rel menu tree Analyzer Ref Rel Impedance Meas Type Meas Lvl Rel Level Frequency Ratio Meas Frq Ref Meas Ratio Ref Off Log Linear Off Delta Off Delta Level Frequency Ratio The valu...

Page 55: ...3 Description Function 1 Frequency Vac Vdc Select the first measurement parameter Function 2 Frequency Vac Vdc SNR Noise Level SINAD THD N Ratio THD N Level Crosstalk Ch Driv Crosstalk Ch Meas SMPTE...

Page 56: ...Peak Select either RMS Quasi Peak or Peak to Peak detection type Filter None Unselect the filter function LPF Select either None 15 kHz 20 kHz 30 kHz or Custom HPF Select either None 22 Hz 100 Hz 400...

Page 57: ...External trigger Ref Rel Meas Type Level Select either Level Frequency or Ratio measurement type Frequency Ratio Impedance Set the reference impedance value Level Set the voltage reference value Frequ...

Page 58: ...ther hand the time domain mode allows you to access the settings for the time domain graph display The figure below shows the frequency and time domain menu trees Figure 2 8 Frequency and time domain...

Page 59: ...rement bandwidth input connection input range AC DC coupling and trigger settings Axis Settings Enter the graph axis values and spacing type You can also choose to perform autoscaling Harmonics Graph...

Page 60: ...ngs List View Save Pts to File Add Point Edit Point Delete Point Table 2 5 Sweep menu description Level 1 Level 2 Description Channel 1 or 2 Select the channel to perform sweep Mode Auto Sweep Auto Li...

Page 61: ...nel Level 1 Level 2 Description List View Add Point Edit Point Delete Point Displays the sweep results in list form You may add sweep points edit the sweep parameter value of a selected point or delet...

Page 62: ...anel will turn on or off the generator output for all active channels Figure 2 11 Run Stop or On Off option Table 2 6 Graph panel key description Item Key Description 1 Peak Search Places a marker on...

Page 63: ...tus on the analyzer channel Figure 2 12 Channel selection and status When the selected analyzer channel is in Run mode the U8903A will take continuous readings as fast as possible based on the specifi...

Page 64: ...ystem panel key description Item Key Description 1 Save Saves the U8903A state to a file 2 Recall Recalls the U8903A state from a file 3 Display Mode Toggles between the number of channels to show on...

Page 65: ...Manager will be launched once you have made your selection Figure 2 14 File Manager menu for saving the U8903A state You may save the current U8903A state to a file in either the U8903A internal memor...

Page 66: ...ate file pressing Recall will display a Recall page For single channel state file the Recall page allows you to select the channel s to apply the settings For module state file except graph the Recall...

Page 67: ...2 16 Analyzer 8 channel display Print This function prints the display to a file on a USB external flash storage Preset This function presets the U8903A to its factory default settings When is presse...

Page 68: ...function menu tree System GPIB Address Enable FTP Control I O Disable Configure Mode LAN Settings Reset Settings Save Settings Automatic Manual Date Time Edit Cancel Save Brightness Service Self Test...

Page 69: ...ice Self Test Complete Test Performs a full instrument self test Customized Test Performs a self test on a particular section of the U8903A Diagnostic Front Panel Performs a diagnostic test on the U89...

Page 70: ...stem on page 15 for the details Level 1 Level 2 Level 3 Level 4 Description Help Language English US Sets the language to English Japanese Sets the language to Japanese French Sets the language to Fre...

Page 71: ...y The U8903A displays the analyzer view upon power up as shown in the following figure Figure 2 18 Power up display Measurement results Measurement status Softkey menu Active channel Function 1 Functi...

Page 72: ...ollowing figure Figure 2 19 Editing function keys The description for each editing key or control is shown in the table below 8 6 2 3 4 5 1 7 Table 2 9 Editing key control description Item Control Des...

Page 73: ...positive or negative value For a negative value toggle this key to enter the negative sign before a numeric value 6 Numeric keys Enter alphanumeric data by using the number keys and decimal point 7 En...

Page 74: ...52 U8903A User s Guide 2 Operation and Features...

Page 75: ...7 AC level detection 58 Digital filters 59 Input configuration 60 Input ranging 61 Common Settings 62 Measurement bandwidth 62 Measurement time 63 Trigger 65 Output Settings 66 Output type 66 Output i...

Page 76: ...e AC DC coupling circuit If AC coupling is selected its DC component is blocked thus only the AC component of the signal passes through to the Ranging circuit However if DC coupling is selected the en...

Page 77: ...tion of up to three digital filters one each from the low pass high pass and weighting filter groups before sending it to the measurement section Signal generation The DSP generates all the required w...

Page 78: ...put Settings The U8903A analyzer inputs can be configured with selectable AC DC coupling AC level detector digital filters Unbalanced Balanced input connections and measurement ranges as shown in the...

Page 79: ...gnal by switching a capacitor in series to the input path The DC coupled setting allows signals to be measured down to 0 Hz This setting should be used when making DC voltage measurements The AC coupl...

Page 80: ...nal true root mean square RMS measurement on the input signal This RMS value includes the DC component unless the AC coupling mode is selected The Peak to Peak detector returns the peak to peak voltag...

Page 81: ...signal simultaneously The U8903A also allows user defined filters to be uploaded to the device Refer to Appendix C User defined Filter File Format on page 144 for more information on the user defined...

Page 82: ...front panel XLR input connectors to the analyzer The signals on the positive and negative XLR pins enter a differential amplifier where they are subtracted before passing on to the detector The Unbal...

Page 83: ...ranging The default range setting is Auto where the analyzer sets the optimum input range based on the input signal amplitude The input range can also be set manually with the values given below 400 m...

Page 84: ...ommon settings Measurement bandwidth The U8903A has two settings for measurement bandwidth The low bandwidth mode has a maximum measurement bandwidth of 30 kHz while the high bandwidth mode can measur...

Page 85: ...ranging from 0 0078125 s equivalent to a measurement rate of 128 readings s to 1 s When the measurement time is set to Gen Track the analyzer will vary the measurement time according to the generator...

Page 86: ...64 U8903A User s Guide 3 Instrument Configuration The measurement time selection is shown as follows Figure 3 9 Measurement time selection first page Figure 3 10 Measurement time selection second page...

Page 87: ...triggers immediately after the previous data is acquired If External triggering is set the analyzer waits for a trigger pulse on the Trigger In connector of the rear panel before acquiring the measure...

Page 88: ...tput settings Output type The output connection can be set to Balanced Unbalanced or Common mode Balanced outputs a pair of differential signals which are equal in amplitude but 180 out of phase on th...

Page 89: ...Instrument Configuration 3 U8903A User s Guide 67 Output impedance The output impedance can be selected as follows Balanced and Common mode 100 600 Unbalanced 50 600...

Page 90: ...68 U8903A User s Guide 3 Instrument Configuration...

Page 91: ...ator Functions Audio Generator 70 Sine waveform 72 Variable phase waveform 73 Dual sine waveform 74 Noise signals 80 DC signal 81 Multitone waveform 82 Square waveform 84 Arbitrary waveform 84 This ch...

Page 92: ...guring the channel You can perform a channel selection by using the arrow keys The generator waveform functions are listed as follows These waveform functions are accessible by pressing the correspond...

Page 93: ...aveform selection is shown as follows Figure 4 1 Generator waveform selection Press More 1 2 to display more generator waveform selection as follows Figure 4 2 More generator waveform selection To sel...

Page 94: ...the sine waveform menu Figure 4 3 Sine waveform menu The sine waveform may be configured with the following parameters Frequency Amplitude DC Offset Frequency is the reciprocal of the period of the si...

Page 95: ...a value of 1 5 V This value is equivalent to the average amplitude of the waveform Variable phase waveform The variable phase mode outputs a sine waveform on all channels The waveforms on all channels...

Page 96: ...Frequency Amplitude Phase 1 Phase 1 refers to the phase of the selected channel with reference to channel 1 Dual sine waveform The dual sine waveform group allows you to generate a composite waveform...

Page 97: ...4 U8903A User s Guide 75 The following figure shows the dual sine waveform selection Figure 4 6 Dual sine waveform selection Dual waveform You can select a generic dual sine waveform as follows Figur...

Page 98: ...ual sine waveform may be configured with the following parameters Frequency 1 Frequency 2 Amplitude Ratio DC Offset Frequency 1 is the frequency of the first sine component Frequency 2 is the frequenc...

Page 99: ...orms consist of a lower and an upper frequency sine waveform at default values of 60 Hz and 7 kHz respectively They are differentiated by the amplitude ratio between the lower and upper frequencies Th...

Page 100: ...ther There are two predefined DFD dual tones consisting of DFD IEC 60268 and DFD IEC 60118 The following figure shows the DFD IEC 60118 waveform menu Figure 4 10 DFD IEC 60118 waveform menu The DFD IE...

Page 101: ...form menu The DFD IEC 60268 waveform may be configured with the following parameters Difference Frequency Center Frequency Amplitude DC Offset Amplitude refers to the amplitude of the composite signal...

Page 102: ...o select the noise signal press Waveform Noise You can select either a Gaussian or Rectangular noise signal as shown in the following figure Figure 4 12 Noise signal selection The Gaussian noise signa...

Page 103: ...wing parameters Amplitude DC Offset DC signal A DC voltage is used when performing amplifier linearity measurements Press Waveform DC to select the DC signal output The following figure shows the DC s...

Page 104: ...eform To select a multitone waveform press Waveform Multitone The multitone waveform menu is shown as follows Figure 4 15 Multitone waveform menu Press More 1 2 to display more multitone waveform para...

Page 105: ...sed to multiply the start frequency to determine the frequency spacing between the tones The phase mode consists of the Zero Phase and Random Phase mode In the Zero Phase mode all frequency components...

Page 106: ...quare waveform menu The square waveform may be configured with the following parameters Frequency Amplitude Arbitrary waveform The arbitrary waveform function enables you to load a digital waveform fi...

Page 107: ...903A User s Guide 85 The following figure shows the arbitrary waveform menu Figure 4 19 Arbitrary waveform menu Press More 1 2 to display more arbitrary waveform parameters as follows Figure 4 20 More...

Page 108: ...ormat on page 141 You may display the arbitrary waveform in the time domain as shown in the following figure Figure 4 21 Arbitrary waveform preview The arbitrary waveform may be configured with the fo...

Page 109: ...e level Vac 93 DC voltage level Vdc 94 THD N Ratio and THD N Level 94 SINAD 96 SNR and Noise Level 97 SMPTE intermodulation distortion SMPTE IMD 99 Difference frequency distortion DFD 100 Phase 101 Cr...

Page 110: ...s simultaneously To configure the measurement functions select the active channel using the arrow keys The main menu functions of the analyzer mode are as follows Function 1 Function 2 Analyzer Settin...

Page 111: ...tions 5 U8903A User s Guide 89 For Function 1 the following measurement functions can be selected Frequency AC voltage DC voltage The measurement functions of Function 1 are shown in the figure below...

Page 112: ...se Level SINAD THD N Ratio THD N Level Crosstalk channel driven channel measured SMPTE IMD DFD IEC 60268 2nd 3rd order DFD IEC 60118 2nd 3rd order Phase With the exception of phase and crosstalk indiv...

Page 113: ...Audio Analyzer Measurement Functions 5 U8903A User s Guide 91 Figure 5 4 Function 2 selection second page Figure 5 5 Function 2 selection third page...

Page 114: ...lters input connection and measurement range before the selected measurement is performed on the incoming signal For more information on the measurement settings refer to Chapter 3 Input Settings on p...

Page 115: ...h frequency noise from the measured signal allowing more stable readings AC voltage level Vac This is the most common measurement function of an AC signal The U8903A provides three types of AC level d...

Page 116: ...evel applying filtering or adding negative feedback In communication devices THD N indicates how well a signal is being reproduced at the receiver after going through the communication medium To limit...

Page 117: ...o is defined as the ratio of the square root of the sum of the squares of all the signal harmonic components and noise amplitude relative to the total signal amplitude The THD N Ratio can be computed...

Page 118: ...se And Distortion SINAD is equal to the reciprocal of the distortion measurement It is mostly used to determine the sensitivity of a communications receiver The ratio computed in the SINAD measurement...

Page 119: ...n of the SNR measurement is a closed loop configuration in which both the generator and the analyzer are used in the test setup Channel 1 of the generator will be used for measurement on the analyzer...

Page 120: ...l measure the UUT output signal amplitude when the generator is routed to the input The noise level is measured when the input of the UUT is terminated with 600 It is expressed in Vrms The ratio betwe...

Page 121: ...function provides a measure of the second and third order intermodulation distortion introduced by the UUT by injecting two pure tones tone 1 and tone 2 where tone 1 is at a much lower frequency than...

Page 122: ...r information on generating dual tones for this test The SMPTE IMD measurement is shown as follows Figure 5 12 SMPTE IMD measurement Difference frequency distortion DFD The DFD measurement is similar...

Page 123: ...measured from a reference waveform The reference is usually the same signal at a different point in the system or a related signal in a different channel of the system Phase is expressed in degrees Ph...

Page 124: ...ed to channel 2 Set the analyzer to measure phase If channel 1 is set as the reference channel the channel 2 result is the interchannel phase delay A phase response measurement compares the phase of t...

Page 125: ...bias point Crosstalk is largely due to capacitive coupling between the channel conductors in the device and generally varies with frequency There are two modes of crosstalk measurement comprising chan...

Page 126: ...e In the channel measured mode as shown below the designated reference channel is used to measure the crosstalk from the other channel to this channel The crosstalk result of the channel indicates the...

Page 127: ...ysis Frequency Domain and Time Domain 106 Monitor settings 108 Input settings 111 Axis settings 111 Harmonics display 112 Graph Functions 113 Peak search 113 Marker 114 Marker 115 Full screen 116 This...

Page 128: ...o access the frequency or time domain mode press or on the Mode panel respectively The settings available in both the frequency and time domain modes are as follows Monitor settings Input settings Axi...

Page 129: ...inuously by pressing Running Mode Continuous The Running Mode Single function enables you to perform a single acquisition of the graph data each time is pressed You also have the option to save the gr...

Page 130: ...nnels 3 to 8 will only be available in future releases The other functions of the monitor settings are listed as follows Analysis mode The analysis mode allows you to set the graph display to either t...

Page 131: ...ncy measurements especially when trying to resolve two frequency components that are close together The Hann window has the best overall filter characteristic and is a good general purpose window for...

Page 132: ...ire and display The possible acquisition lengths are as follows 256 512 1024 2048 4096 8192 16384 32768 Synchronous averaging Synchronous averaging reduces noise levels by averaging the acquired data...

Page 133: ...gs section The trigger source selection consists of Free Run External Channel 1 and Channel 2 Refer to Chapter 3 Input Settings on page 56 and Common Settings on page 62 for more information on the in...

Page 134: ...les you to display the level of each signal harmonic component of the frequency domain analysis You may select the channel and enter the number of harmonic component levels to be displayed The signal...

Page 135: ...can set the threshold level that the marker can identify as a peak or minimum on the graph If the trace is above the threshold level it will be identified as a peak whereas the trace below the thresh...

Page 136: ...8 Marker menu Using the marker functions you may set the current and reference markers to be placed on the graph for the selected channel The markers can be moved along the graph plot by rotating the...

Page 137: ...ased on the selected current marker position Using the softkeys you may configure the graph area to be displayed by positioning the current marker at either the center start or stop point of the graph...

Page 138: ...rker menu is shown as follows Figure 6 10 Marker menu Full screen This function enables you to maximize the graph view to the full display size by pressing on the Graph panel To exit the full screen m...

Page 139: ...gies U8903A Audio Analyzer User s Guide 7 Sweep Function Sweep 118 Sweep mode 120 Sweep settings 121 I O settings 122 Axis settings 123 List view 124 This chapter describes the U8903A sweep functions...

Page 140: ...de a generator parameter such as frequency amplitude or phase is varied across a certain range At each point of the sweep an analyzer measurement is made The sweep mode allows you to easily collect an...

Page 141: ...file by pressing Save Pts to File To load the sweep points from a file press Load Pts to List The File Manager will be launched to allow you to save or load the sweep points Refer to Chapter 2 Save on...

Page 142: ...to Auto Sweep pressing will initiate the sweep from start to end Sweep points are based on the Start Stop and Step Size sweep parameter settings Manual Sweep If the sweep mode is set to Manual Sweep p...

Page 143: ...ment each time is pressed Sweep settings The sweep settings page is shown as follows Figure 7 4 Sweep settings page The sweep parameter selection will vary according to the selected waveform type The...

Page 144: ...hich represents the delay for each measurement to be taken during the sweep You may select an analyzer measurement function as the measurement parameter during the sweep If phase is selected as the me...

Page 145: ...dwidth input connection and range coupling measurement time as well as the output connection and impedance Axis settings You can manually change the X axis and Y axis settings such as the minimum and...

Page 146: ...ion allows you to display the sweep results in list form Figure 7 7 List View Pressing Add Point enables you to add sweep points below the list You may edit the sweep parameter value of a selected poi...

Page 147: ...cations Characteristics 126 Specifications 127 Audio generator 127 Audio analyzer 130 Graph mode 132 Audio filters 132 Sweep capability 133 Measurement Category 135 Measurement category definitions 13...

Page 148: ...sing Altitude up to 3000 m Pollution Degree 2 Installation Category II STORAGE COMPLIANCE 55 C to 75 C SAFETY COMPLIANCE Certified with IEC 61010 1 2001 EN61010 1 2001 2nd Edition Canada CAN CSA C22 2...

Page 149: ...ND VARIABLE PHASE Frequency Range 5 Hz to 80 kHz Accuracy 5 ppm Resolution 0 1 Hz Output Range Balanced 0 V to 16 Vrms Range Unbalanced Common 0 V to 8 Vrms Amplitude accuracy 1 Amplitude resolution 1...

Page 150: ...C 60118 IEC 60268 Frequency Difference frequency 80 Hz to 2 kHz Upper frequency 3 kHz to 80 kHz Center frequency 3 kHz to 79 kHz Output Range Balanced 0 V to 16 Vrms Range Unbalanced Common 0 V to 8 V...

Page 151: ...Phase DC and Square Output level Range 11 3 V to 11 3 V Amplitude accuracy 1 5 OUTPUT CHARACTERISTICS Connection type Balanced XLR Unbalanced BNC Common mode XLR Impedance Balanced 100 600 Unbalanced...

Page 152: ...nced 100 k Flatness 20 Hz to 20 kHz 0 01 dB 3 at 23 C 5 C 0 012 dB 4 from 0 C to 55 C 20 kHz to 100 kHz 0 1 dB at 23 C 5 C 0 15 dB from 0 C to 55 C THD N at 1 kHz 1 Vrms 20 Hz to 20 kHz bandwidth 101...

Page 153: ...o 100 kHz Minimum input 1 mV S N 40 dB Accuracy 5 ppm Resolution 6 digits PHASE Accuracy 20 kHz 2 100 kHz 4 Minimum input 1 mV S N 40 dB Resolution 0 01 SMPTE IMD Residual IMD 0 0025 92 dB 1 For the a...

Page 154: ...e Value Frequency domain Displays highest FFT bin between graph points Low pass filter 15 kHz low pass 20 kHz low pass 30 kHz low pass User defined 1 High pass filter 20 Hz high pass 100 Hz high pass...

Page 155: ...D 1 1 4 1 10 1 WAVEFORM Start point Upper frequency 2 kHz to 60 kHz Start point Lower frequency 40 Hz to 500 Hz Stop point Upper frequency 2 kHz to 60 kHz Stop point Lower frequency 40 Hz to 500 Hz Am...

Page 156: ...spot value SMPTE IMD 1 1 4 1 10 1 waveform 40 Hz to 500 Hz lower frequency 2 kHz to 60 kHz upper frequency Frequency spot value DFD IEC 60118 IEC 60268 waveform 3 kHz to 80 kHz upper frequency 3 kHz t...

Page 157: ...which are directly connected to the low voltage installation For example measurements on household appliances portable tools and similar equipment Measurement CAT III Measurements performed in fixed...

Page 158: ...136 U8903A User s Guide 8 Specifications...

Page 159: ...de 6 42 45 132 dual sine waveforms 2 19 27 70 74 127 E editing keys 6 50 F file maintenance 43 44 front panel 5 22 47 fuse 12 G generator features 2 18 menu 23 27 output settings 26 29 66 129 specific...

Page 160: ...aveform 27 72 127 SMPTE IMD 27 33 77 99 128 131 140 SNR 33 97 square waveform 29 84 127 sweep file 39 119 147 menu 38 118 mode 38 120 settings 38 121 148 specifications 133 system menu 42 46 47 T THD...

Page 161: ...er User s Guide Appendixes Appendix A SMPTE IMD and DFD Default Settings 140 Appendix B Arbitrary File Format 141 Appendix C User defined Filter File Format 144 Appendix D User defined Sweep Points Fi...

Page 162: ...owing table SMPTE 1 1 SMPTE 4 1 SMPTE 10 1 Amplitude ratio of the lower frequency to upper frequency 1 1 4 1 10 1 Upper frequency 7 kHz 7 kHz 7 kHz Lower frequency 60 Hz 60 Hz 60 Hz Amplitude 0 Vrms 0...

Page 163: ...ad an arbitrary file The File Manager will be launched to allow you to select the file to be loaded Once you recall an arbitrary file the waveform preview page will appear as shown in the following ex...

Page 164: ...2 5 kHz Thus the interval between samples is 3 2 s 1 312 5 Parameter Range Vpeak 0 to 22 6 Vp Balanced output connection 0 to 11 3 Vp Unbalanced or Common output connection DC offset 11 3 V to 11 3 V...

Page 165: ...ratio to the maximum Vpeak 2 DC offset 3 Points 0 1 1 5 1 0 2 4 6 4 2 Any of the following conditions may cause an error or warning message to appear Unable to load the sample points as the points may...

Page 166: ...FIR You need to specify the coefficients or sections as well as group delay for the respective filter type Use the following examples to configure the filter file format The file is saved in the juf f...

Page 167: ...0 021888116917017919 Section 1 Gain1 1 Section 1 A1 0 1 8522189864275376 Section 1 A1 1 0 93977145409560914 Section 1 A1 2 1 Section 1 B1 0 2 Section 1 B1 1 1 Section 1 B1 2 0 020670375338350408 Sect...

Page 168: ...nts for the FIR filter type and up to 36 sections for the IIR filter The number of FIR coefficients must not be less than four while the minimum number of sections allowed for IIR is one seven coeffic...

Page 169: ...explains how to configure the user defined sweep points file You may specify the values of the sweep points in a row or column For example 100 200 300 400 500 or 100 200 300 400 500 The file is saved...

Page 170: ...Frequency DFD IEC 60268 Difference Frequency Center Frequency DC Gaussian Rectangular Phase Variable Phase Frequency Amplitude Frequency Sine Square Amplitude Frequency 1 Dual Amplitude Frequency 2 Fr...

Page 171: ...4866 China tel 800 810 0189 fax 800 820 2816 Europe tel 31 20 547 2111 Japan tel 81 426 56 7832 fax 81 426 56 7840 Korea tel 080 769 0800 fax 080 769 0900 Latin America tel 305 269 7500 Taiwan tel 08...

Reviews: