36
U8903A User’s Guide
2
Operation and Features
Graph (Frequency domain and Time domain)
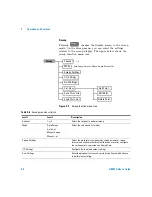
Pressing
or
changes the display screen to
the frequency domain or time domain display respectively.
In the frequency domain mode, you can select the settings
related to the frequency domain graph display. On the other
hand, the time domain mode allows you to access the
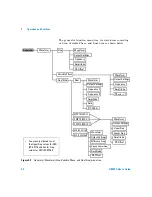
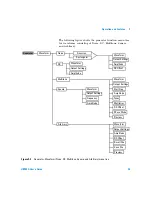
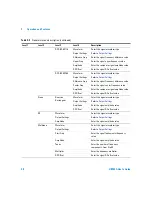
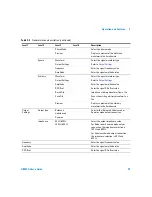
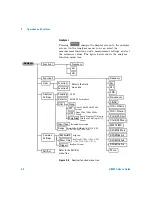
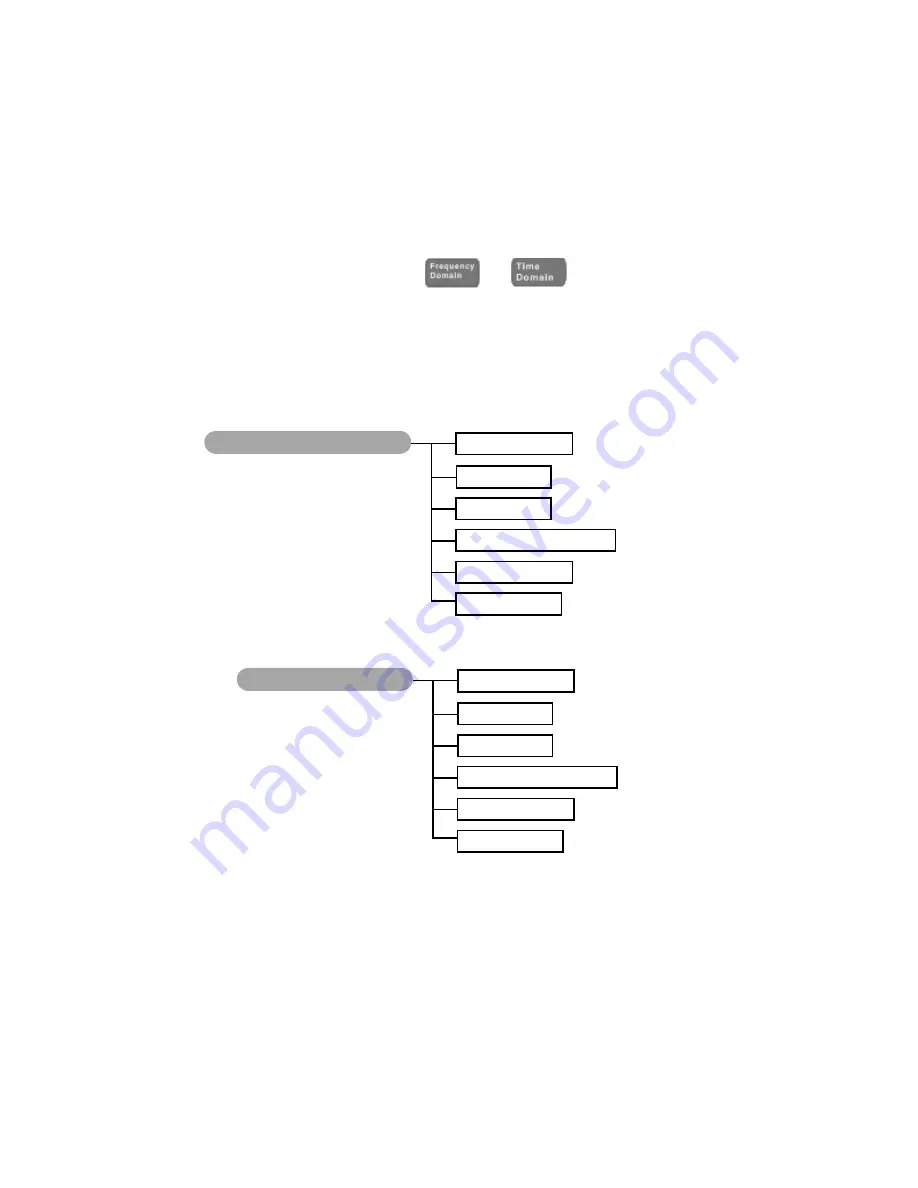
settings for the time domain graph display. The figure below
shows the frequency and time domain menu trees.
Figure 2-8
Frequency and time domain menu trees
Graph (Frequency Domain)
Input Settings
Monitor Settings
Axis Settings
Running Mode
Harmonics/Graph View
Save Pts to File
Continuous, Single
Graph (Time Domain)
Input Settings
Monitor Settings
Axis Settings
Running Mode
Harmonics/Graph View
Save Pts to File
Continuous, Single
Not applicable
Summary of Contents for u8903a
Page 1: ...Agilent Technologies Agilent U8903A Audio Analyzer User s Guide...
Page 12: ...XII U8903A User s Guide...
Page 20: ...XX U8903A User s Guide...
Page 22: ...XXII U8903A User s Guide...
Page 38: ...16 U8903A User s Guide 1 Getting Started...
Page 74: ...52 U8903A User s Guide 2 Operation and Features...
Page 90: ...68 U8903A User s Guide 3 Instrument Configuration...

