108
U8903A User’s Guide
6
Frequency and Time Domain Analysis
Monitor settings
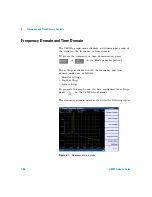
The following figure shows the monitor settings page.
Figure 6-3
Monitor settings page
The monitor settings page enables you to select the
channel(s) to acquire the graph data for display. The valid
channels are channels 1 and 2, while channels 3 to 8 will
only be available in future releases. The other functions of
the monitor settings are listed as follows.
Analysis mode
The analysis mode allows you to set the graph display to
either time domain, frequency domain (magnitude), or
frequency domain (phase).
In the time domain mode, the steps involved are acquiring
the data and displaying the results. On the other hand, the
steps for the frequency domain mode consist of acquiring
the data, performing the FFT operation, and processing the
results for graphing.
Summary of Contents for u8903a
Page 1: ...Agilent Technologies Agilent U8903A Audio Analyzer User s Guide...
Page 12: ...XII U8903A User s Guide...
Page 20: ...XX U8903A User s Guide...
Page 22: ...XXII U8903A User s Guide...
Page 38: ...16 U8903A User s Guide 1 Getting Started...
Page 74: ...52 U8903A User s Guide 2 Operation and Features...
Page 90: ...68 U8903A User s Guide 3 Instrument Configuration...


