Operation and Features
2
U8903A User’s Guide
37
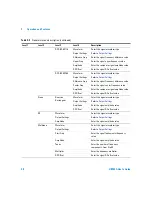
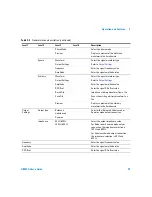
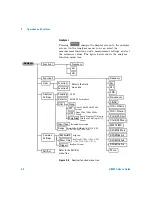
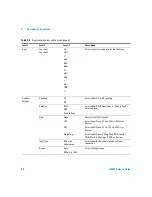
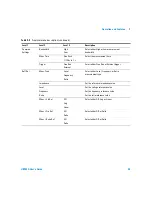
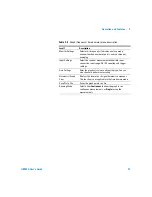
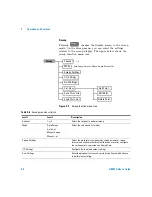
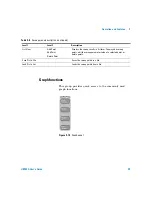
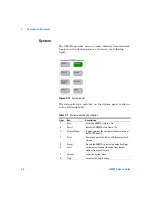
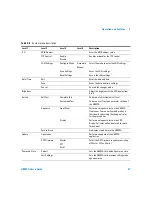
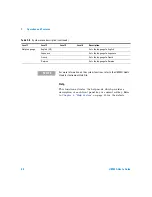
Table 2-4
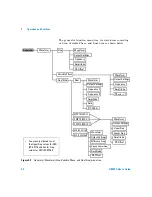
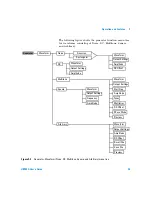
Graph (frequency/time domain) menu description
Level 1
Description
Monitor Settings
Select which channel(s) to display, analysis mode,
window function, number of points, and synchronous
averaging
Input Settings
Select the channel, measurement bandwidth, input
connection, input range, AC/DC coupling, and trigger
settings
Axis Settings
Enter the graph axis values and spacing type. You can
also choose to perform autoscaling.
Harmonics/Graph
View
Displays the level of each signal harmonic component.
This function is not applicable in the time domain mode.
Save Pts to File
Saves the graph points to a file
Running Mode
Select either
Continuous
to allow the graph to run
continuous measurements, or
Single
to stop the
measurements
Summary of Contents for u8903a
Page 1: ...Agilent Technologies Agilent U8903A Audio Analyzer User s Guide...
Page 12: ...XII U8903A User s Guide...
Page 20: ...XX U8903A User s Guide...
Page 22: ...XXII U8903A User s Guide...
Page 38: ...16 U8903A User s Guide 1 Getting Started...
Page 74: ...52 U8903A User s Guide 2 Operation and Features...
Page 90: ...68 U8903A User s Guide 3 Instrument Configuration...


