Dual and Dual Broadband NMR Probes
20
Dual and Dual Broadband NMR Probes Installation
01-999124-00 J 0606
5.
Enter
ga
to acquire the spectrum. Phase the spectrum, set
wp=250
, and plot using
pl
. Increase
vs
by a factor of 100 and plot the expanded spectrum using
pl
pscale
page
.
If floor vibration results in excessive
noise around the base of the peak,
nt
can be set to a larger value (e.g.,
nt=4
or
nt=16
); however, if extreme
vibrations are present, it may be
impossible to measure the lineshape
accurately. :
6.
Measure lineshape as the linewidth of
the CHCl
3
peak at 50%, 0.55% and
0.11% of the main peak amplitude.
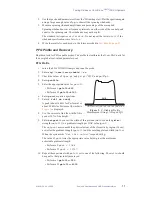
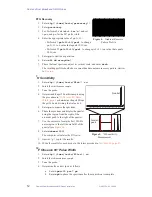
Refer to
and use the substeps
below to determine the lineshape
a.
Display and expand the desired peak.
b.
Enter
nm
, then
dc
for drift correction to ensure a flat baseline. Set
vs=10000
. Place a cursor on the chloroform line and enter
nl
dres
(the
50% level).
c.
Enter
nm
, then
dc
for drift correction to ensure a flat baseline. Set
vs=10000
. Click the VNMR menu button labeled Th to display the
horizontal threshold cursor. Set
th=55
(the 0.55% level).
d.
Click the first menu button labeled Cursor or Box to display two vertical
cursors, and align them on the intersections of the horizontal cursor and the
peak. Enter
delta?
to see the difference in Hz between the cursors.
e.
Set
th=11
(the 0.11% level) and repeat.
7.
Write the results for each probe in the forms provided in
8.
After the specifications are met, do the following:
• Write down the values for
z0
,
lockpower
, and
lockgain
as they appear in
the
Acqi
window. Use the forms provided in
.
• Save the shims by entering in the VNMR input window:
svs('acetone')
1
H Spinning Sidebands
This test and the
1
H spinning resolution and lineshape test (the previous test) must be
passed simultaneously and both tests plotted together.
1.
Using the appropriate CHCl
3
sample, measure the
1
H spinning sidebands on the
same spectrum as the
1
H lineshape test.
2.
Use the spectra and parameter set from the lineshape test.
Plot the spectrum again using a large enough value of
wp
to show all the spinning
sidebands.
3.
Measure spinning sideband amplitudes as a percentage of the main peak.
Spinning sidebands occur at frequency intervals on either side of the central peak
equal to the spinning rate. The sidebands might not be split.
4.
The standard test requires
nt=4
. If the sidebands meet specifications at
nt=4
,
repeating the test at
nt=16
is not necessary.
5.
Write the results for each probe in the forms provided in
Figure 7.
1
H Lineshape Spinning
Measurement
Hz
-120
-100
-80
-60
-40
-20
0
20
40
60
80
100
120
140
13
C satellite
13
C satellite
CHCl
3
peak
0.11%
0.55%

