Measuring point scans and Output
Function
MemoryFree
e.g.:
MemoryFree:
0378.4
kB
Memory data output (s. 11.2.6):
<PRINT>
Clear memory:
<CMEM>
10.3.4 Output of Menu Functions
Each data menu, together with all displayed functions, can be output via inter-
face to a printer or computer (connection of peripheral devices, see manual
5.2). If you have selected the standard display, pressing the key
<PRINT>
leads
to a printout of the following listing:
Print data menu:
<PRINT>
Meas. point, meas. value, designation:
01:+0023.5 °C Temperature
MAXIMUM: 01:+0020.0 °C
MINIMUM: 01:-0010.0 °C
PRINTTIMER: 00:01:23
Total memory capacity, free mem. in kB
MEMORY: S0512.1 F0324.4 A
The listing of the individual functions is given in section 6.6.1.
10.3.5 Displaying Measured Values as a Line Diagram
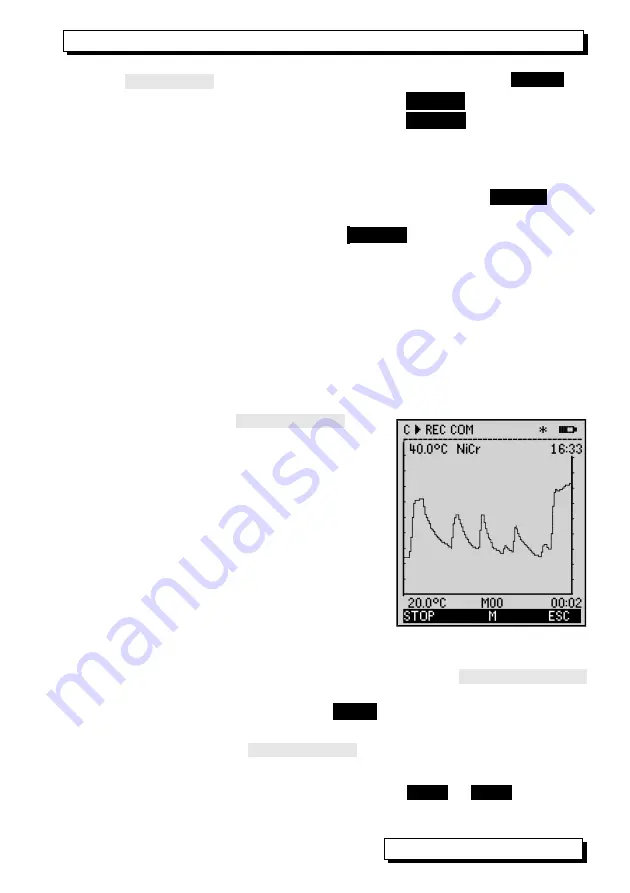
When using the menu
Line diagram
the
meas. value of the selected channel is indi-
cated as a line chart with 100x200 dots as
soon as a measurement is started. The curve
continuously moves from the right to the left,
the time resolution is determined by the
cycle
,
each scan involves one point (dot). Therefore,
time data for the whole t axis is given as (days)
hours:minutes in the bottom right corner. In the
upper right corner the time of day is indicated.
In this mode, the curve is also updated during
an active measurement, if the user leaves the
menu (in this case, do not change the meas.
point!).
Limits, if activated, are entered as dotted lines.
The functions
Analog Start
and
Analog End
of the menu
Special functions
(s. 11.4.4) can be used to set the display range of the y-axis. They can also be
entered directly at the axis using the key
PROG
.
Displaying a measured value as line chart:
Enter the cycle in the menu
Times - Cycles
.
Cycle: 00:00:05
Time axis 120 x 5s = 10min:
00:10
Select meas. channels using the keys:
or
...
ALMEMO
®
2890-9
31

